| __timestamp | Rockwell Automation, Inc. | United Rentals, Inc. |
|---|---|---|
| Wednesday, January 1, 2014 | 6623500000 | 5685000000 |
| Thursday, January 1, 2015 | 6307900000 | 5817000000 |
| Friday, January 1, 2016 | 5879500000 | 5762000000 |
| Sunday, January 1, 2017 | 6311300000 | 6641000000 |
| Monday, January 1, 2018 | 6666000000 | 8047000000 |
| Tuesday, January 1, 2019 | 6694800000 | 9351000000 |
| Wednesday, January 1, 2020 | 6329800000 | 8530000000 |
| Friday, January 1, 2021 | 6997400000 | 9716000000 |
| Saturday, January 1, 2022 | 7760400000 | 11642000000 |
| Sunday, January 1, 2023 | 9058000000 | 14332000000 |
| Monday, January 1, 2024 | 8264200000 | 15345000000 |
In pursuit of knowledge
In the ever-evolving landscape of industrial services and automation, United Rentals, Inc. and Rockwell Automation, Inc. have showcased remarkable revenue trajectories over the past decade. From 2014 to 2024, United Rentals has consistently outpaced Rockwell Automation, with a staggering 170% increase in revenue, reaching its peak in 2024. This growth underscores United Rentals' strategic expansion and market dominance.
Conversely, Rockwell Automation, while experiencing a steady climb, saw a more modest 25% increase over the same period. The year 2023 marked a significant milestone for Rockwell, with revenues peaking at 9 billion, reflecting its resilience and adaptability in the automation sector.
This comparative analysis not only highlights the dynamic nature of these industries but also offers insights into the strategic maneuvers that have propelled United Rentals to the forefront, while Rockwell Automation continues to solidify its position in the market.
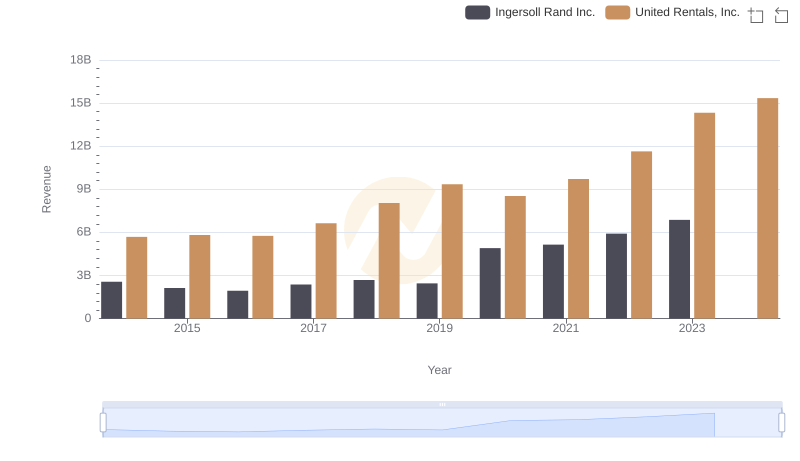
United Rentals, Inc. vs Ingersoll Rand Inc.: Examining Key Revenue Metrics
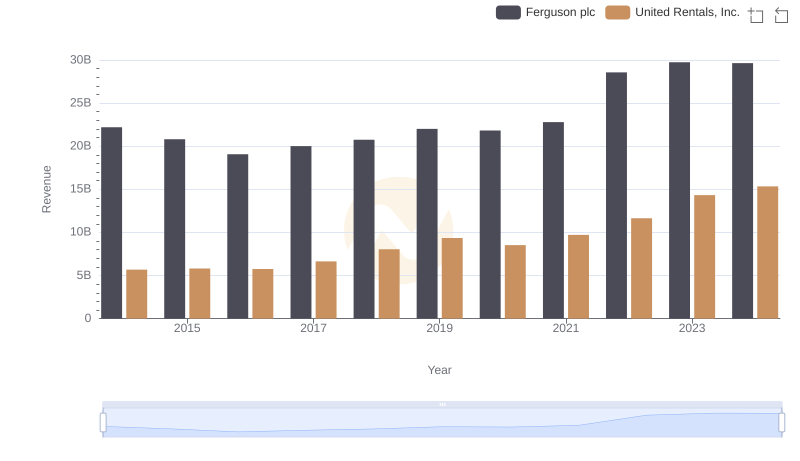
United Rentals, Inc. or Ferguson plc: Who Leads in Yearly Revenue?
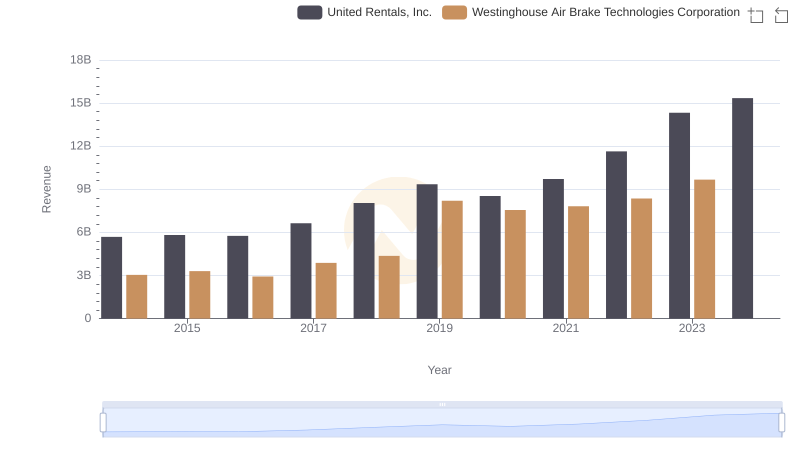
United Rentals, Inc. and Westinghouse Air Brake Technologies Corporation: A Comprehensive Revenue Analysis
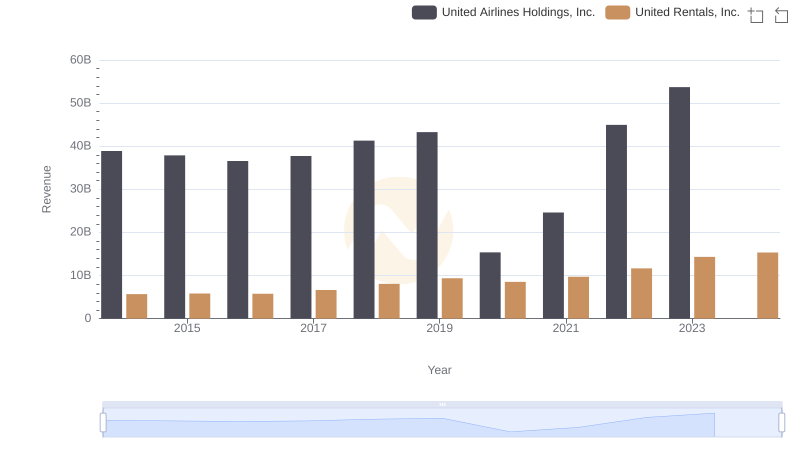
United Rentals, Inc. vs United Airlines Holdings, Inc.: Examining Key Revenue Metrics
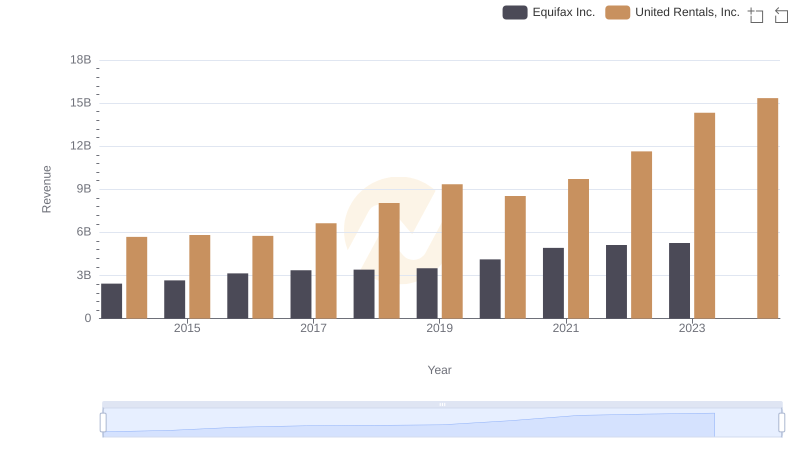
United Rentals, Inc. vs Equifax Inc.: Annual Revenue Growth Compared
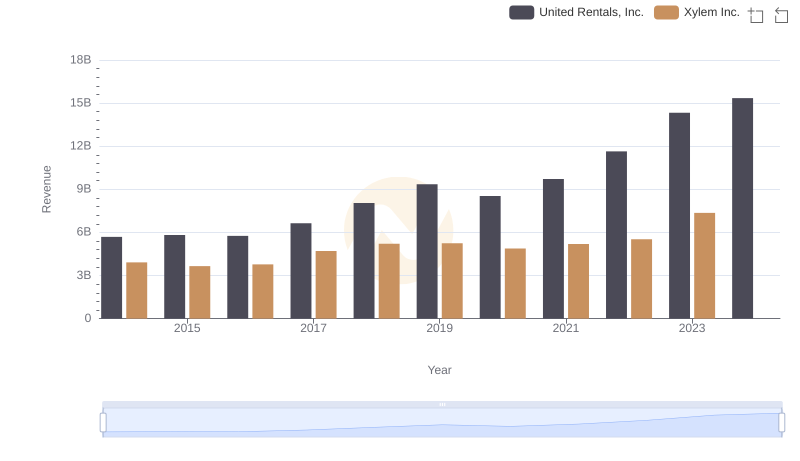
United Rentals, Inc. vs Xylem Inc.: Examining Key Revenue Metrics
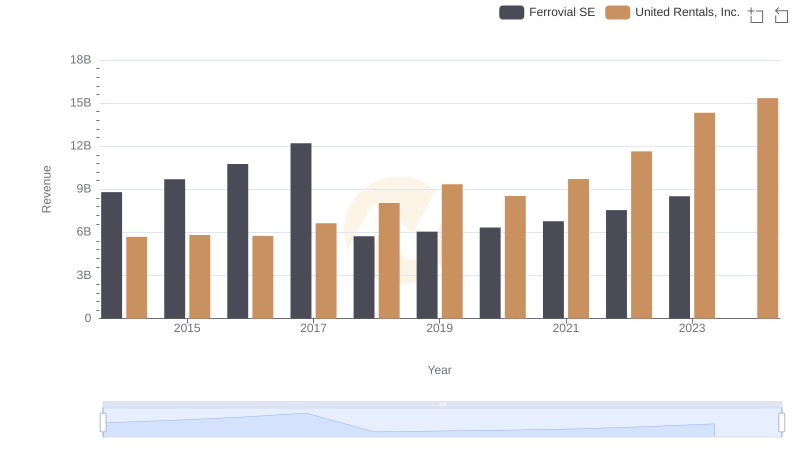
United Rentals, Inc. or Ferrovial SE: Who Leads in Yearly Revenue?
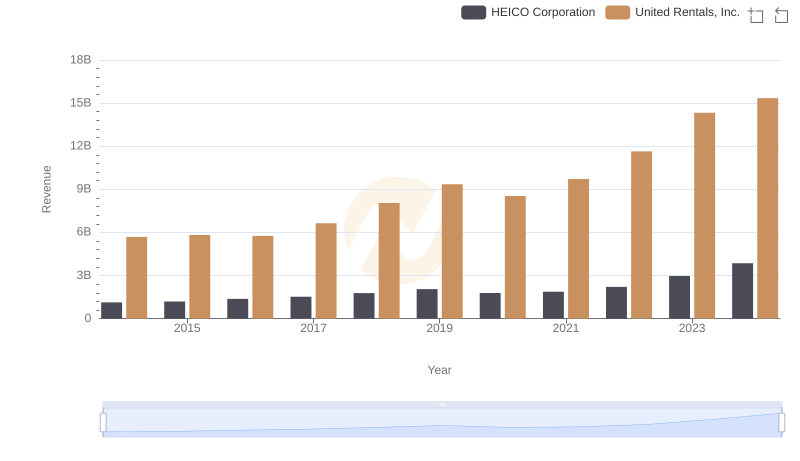
Who Generates More Revenue? United Rentals, Inc. or HEICO Corporation
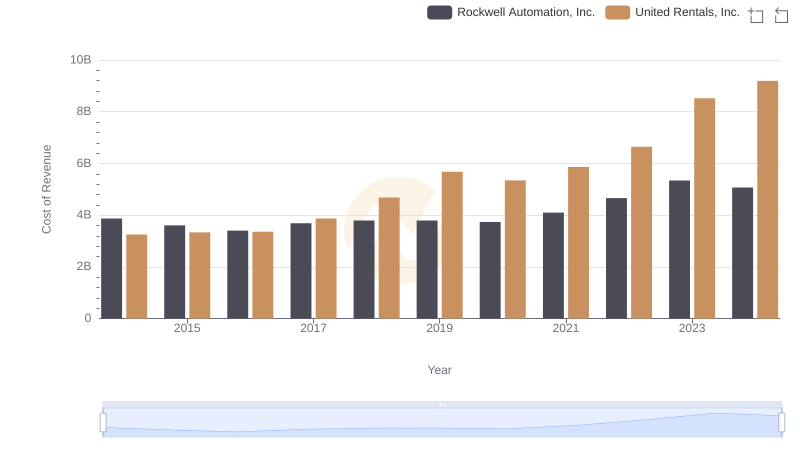
Cost of Revenue Comparison: United Rentals, Inc. vs Rockwell Automation, Inc.
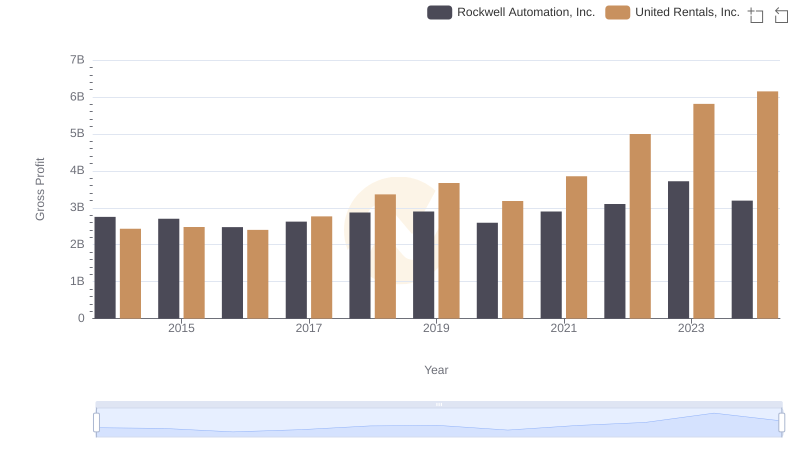
Who Generates Higher Gross Profit? United Rentals, Inc. or Rockwell Automation, Inc.
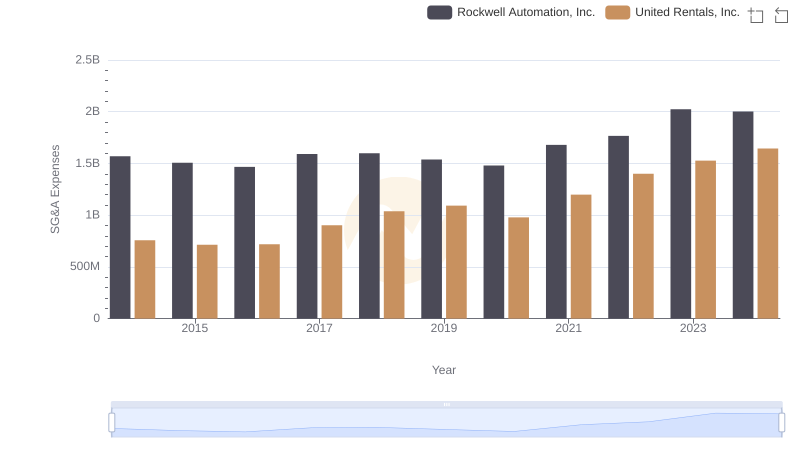
United Rentals, Inc. vs Rockwell Automation, Inc.: SG&A Expense Trends
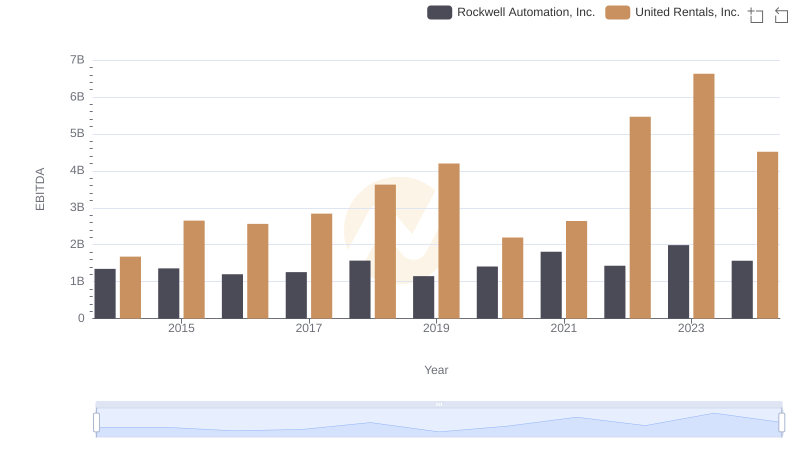
EBITDA Metrics Evaluated: United Rentals, Inc. vs Rockwell Automation, Inc.