| __timestamp | Ferguson plc | United Rentals, Inc. |
|---|---|---|
| Wednesday, January 1, 2014 | 6203188666 | 2432000000 |
| Thursday, January 1, 2015 | 5816457079 | 2480000000 |
| Friday, January 1, 2016 | 5389727937 | 2403000000 |
| Sunday, January 1, 2017 | 5793596551 | 2769000000 |
| Monday, January 1, 2018 | 6044000000 | 3364000000 |
| Tuesday, January 1, 2019 | 6458000000 | 3670000000 |
| Wednesday, January 1, 2020 | 6421000000 | 3183000000 |
| Friday, January 1, 2021 | 6980000000 | 3853000000 |
| Saturday, January 1, 2022 | 8756000000 | 4996000000 |
| Sunday, January 1, 2023 | 9025000000 | 5813000000 |
| Monday, January 1, 2024 | 9053000000 | 6150000000 |
Unleashing the power of data
In the ever-evolving landscape of industrial services, United Rentals, Inc. and Ferguson plc have emerged as formidable players. Over the past decade, Ferguson plc has consistently outperformed United Rentals in terms of gross profit, boasting an average of approximately $6.9 billion annually. However, United Rentals has shown remarkable growth, with its gross profit increasing by over 150% from 2014 to 2024.
This data underscores the dynamic nature of the industry, with both companies adapting and thriving in a competitive market.
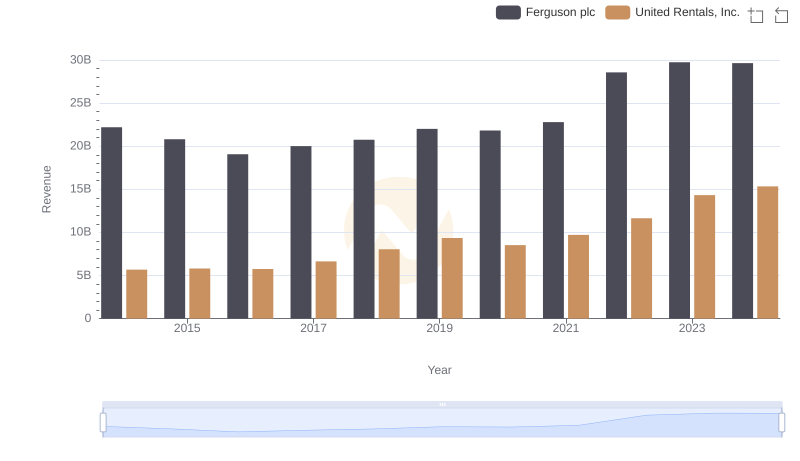
United Rentals, Inc. or Ferguson plc: Who Leads in Yearly Revenue?
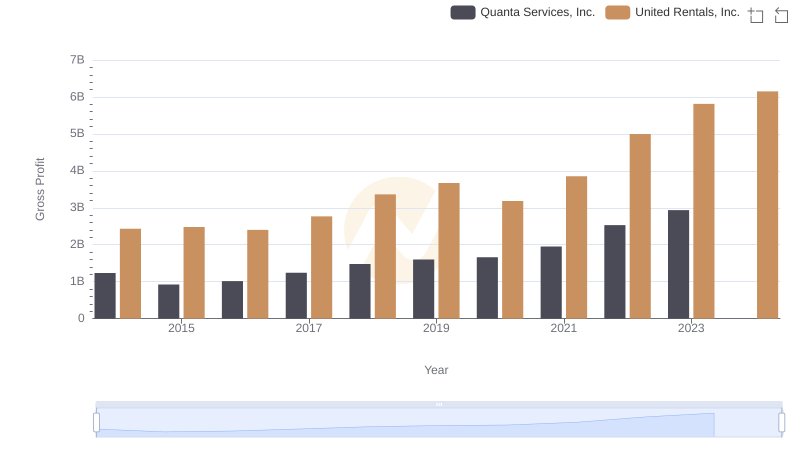
Gross Profit Comparison: United Rentals, Inc. and Quanta Services, Inc. Trends
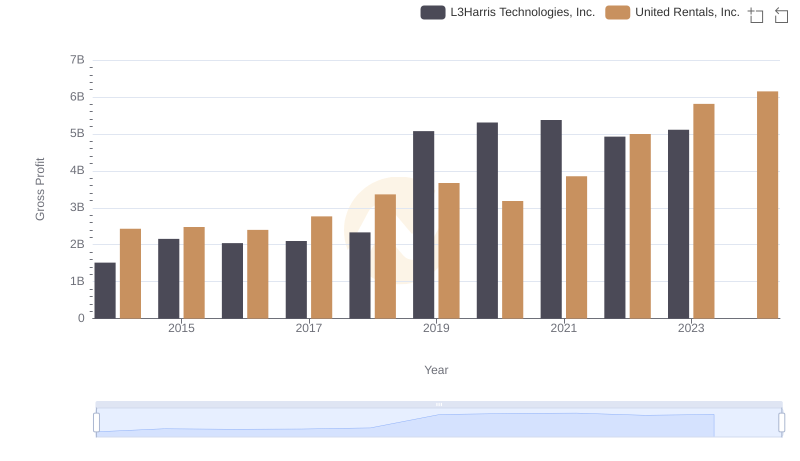
United Rentals, Inc. vs L3Harris Technologies, Inc.: A Gross Profit Performance Breakdown
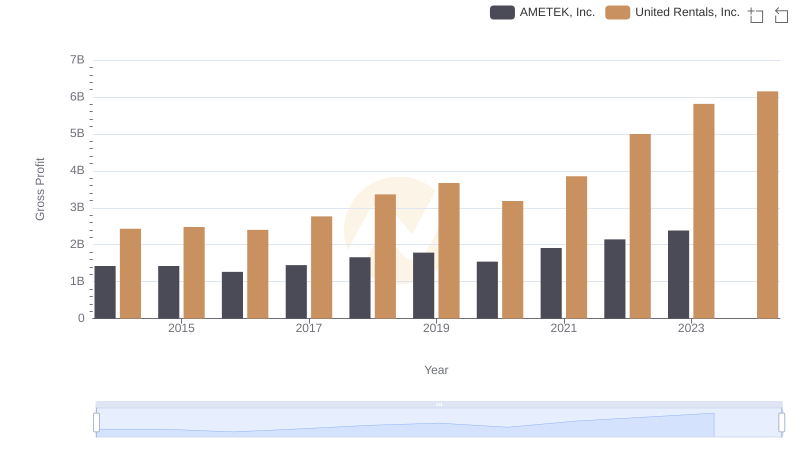
Gross Profit Analysis: Comparing United Rentals, Inc. and AMETEK, Inc.
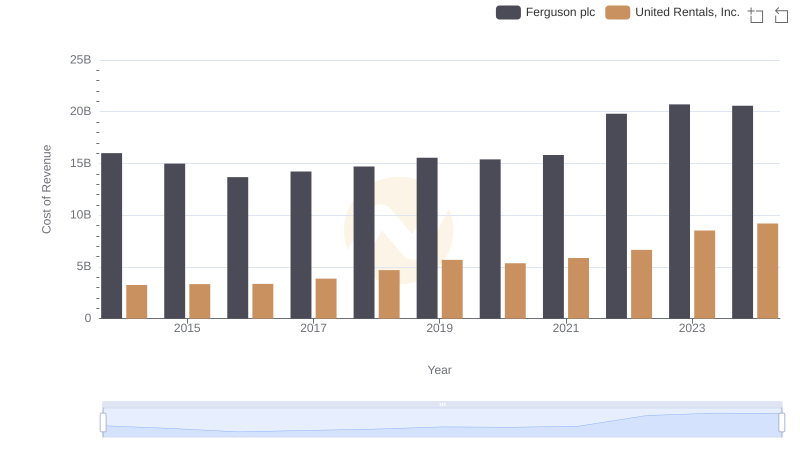
Cost of Revenue Comparison: United Rentals, Inc. vs Ferguson plc
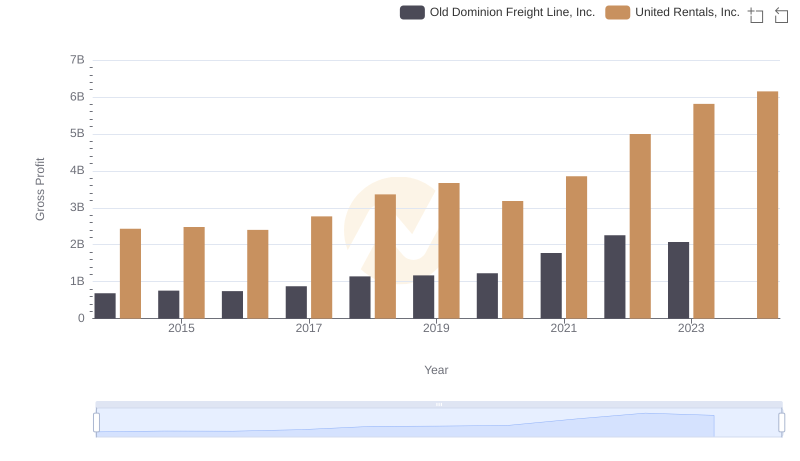
Gross Profit Comparison: United Rentals, Inc. and Old Dominion Freight Line, Inc. Trends
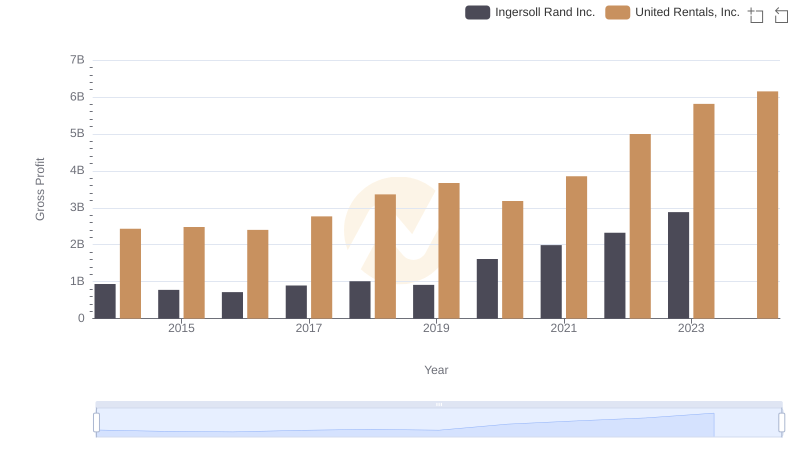
United Rentals, Inc. and Ingersoll Rand Inc.: A Detailed Gross Profit Analysis
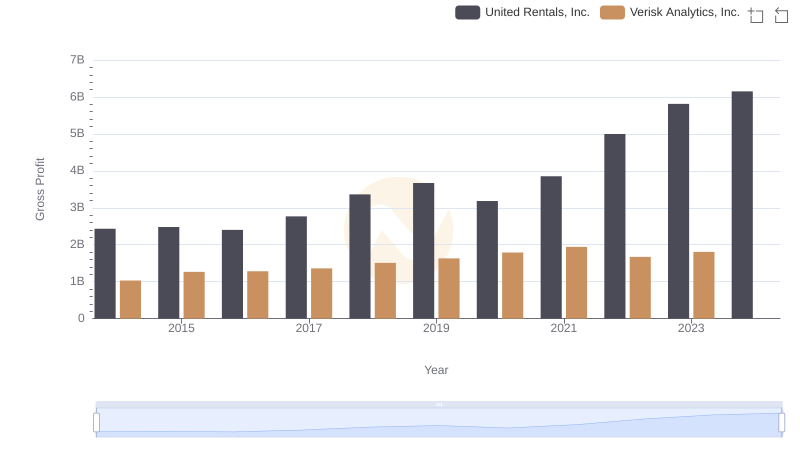
Gross Profit Trends Compared: United Rentals, Inc. vs Verisk Analytics, Inc.
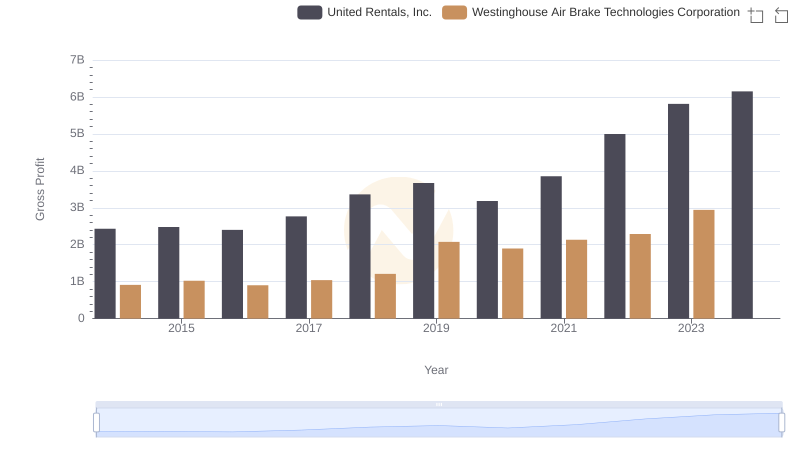
United Rentals, Inc. and Westinghouse Air Brake Technologies Corporation: A Detailed Gross Profit Analysis
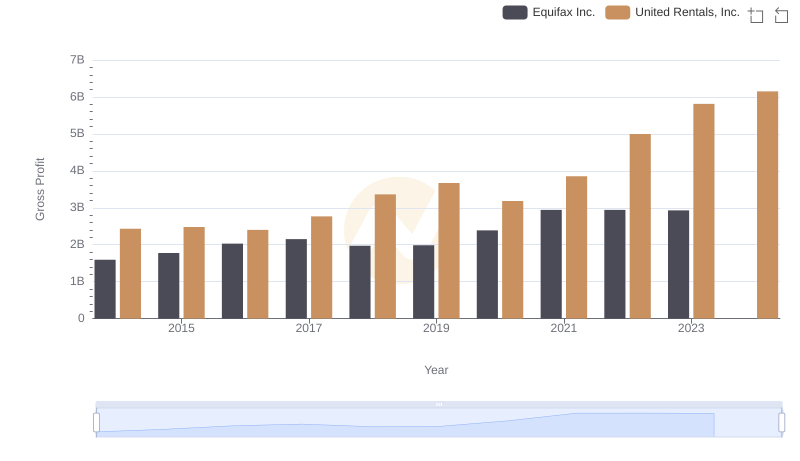
Gross Profit Comparison: United Rentals, Inc. and Equifax Inc. Trends
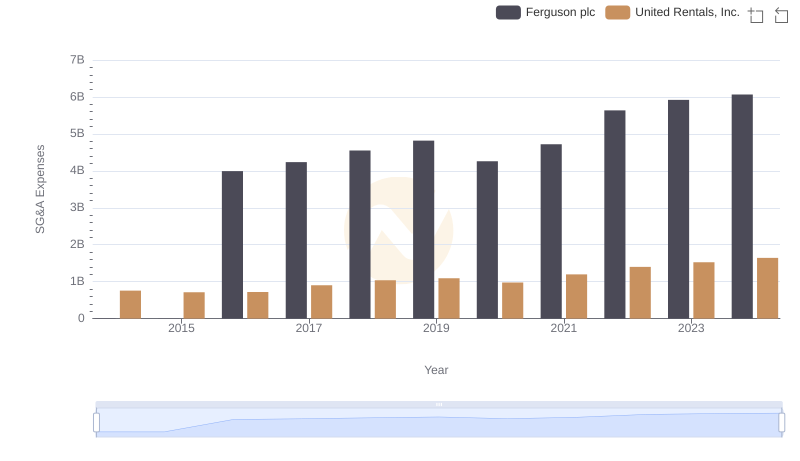
Comparing SG&A Expenses: United Rentals, Inc. vs Ferguson plc Trends and Insights
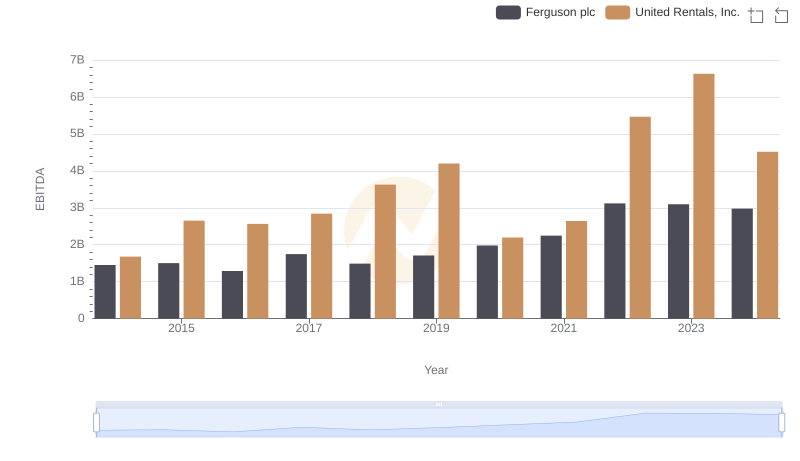
Comprehensive EBITDA Comparison: United Rentals, Inc. vs Ferguson plc