| __timestamp | Ferguson plc | United Rentals, Inc. |
|---|---|---|
| Wednesday, January 1, 2014 | 1450623023 | 1678000000 |
| Thursday, January 1, 2015 | 1500920522 | 2653000000 |
| Friday, January 1, 2016 | 1289082542 | 2566000000 |
| Sunday, January 1, 2017 | 1746753588 | 2843000000 |
| Monday, January 1, 2018 | 1487000000 | 3628000000 |
| Tuesday, January 1, 2019 | 1707000000 | 4200000000 |
| Wednesday, January 1, 2020 | 1979000000 | 2195000000 |
| Friday, January 1, 2021 | 2248000000 | 2642000000 |
| Saturday, January 1, 2022 | 3120000000 | 5464000000 |
| Sunday, January 1, 2023 | 3097000000 | 6627000000 |
| Monday, January 1, 2024 | 2978000000 | 4516000000 |
Unveiling the hidden dimensions of data
In the ever-evolving landscape of industrial services, United Rentals, Inc. and Ferguson plc have emerged as formidable players. Over the past decade, United Rentals has consistently outperformed Ferguson in terms of EBITDA, showcasing a robust growth trajectory. From 2014 to 2023, United Rentals' EBITDA surged by nearly 295%, peaking in 2023 with a remarkable 6.6 billion. In contrast, Ferguson plc experienced a more modest growth of approximately 113% during the same period, reaching its highest EBITDA of 3.1 billion in 2022.
The year 2020 marked a significant dip for both companies, likely due to global economic disruptions, but they quickly rebounded. By 2023, United Rentals had nearly doubled its EBITDA compared to 2019, while Ferguson's growth was more gradual. This comparison highlights the dynamic nature of the industry and the strategic maneuvers that have propelled United Rentals ahead.
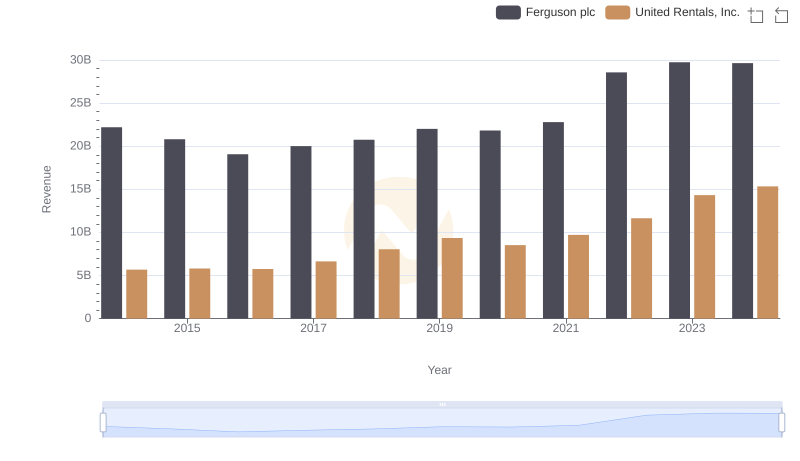
United Rentals, Inc. or Ferguson plc: Who Leads in Yearly Revenue?
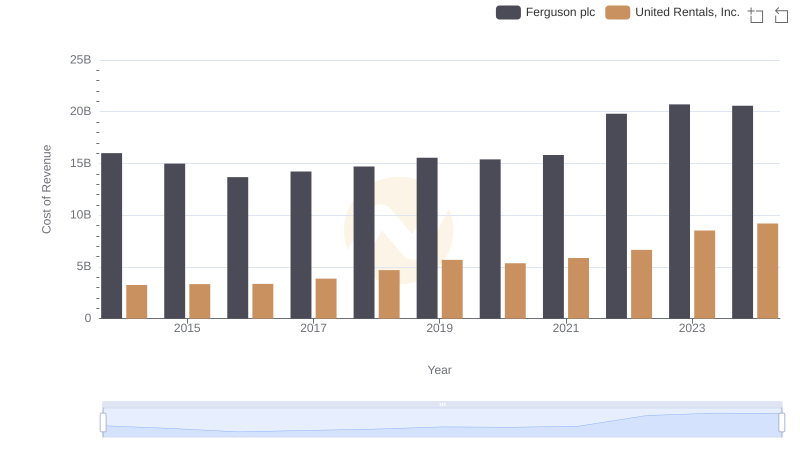
Cost of Revenue Comparison: United Rentals, Inc. vs Ferguson plc
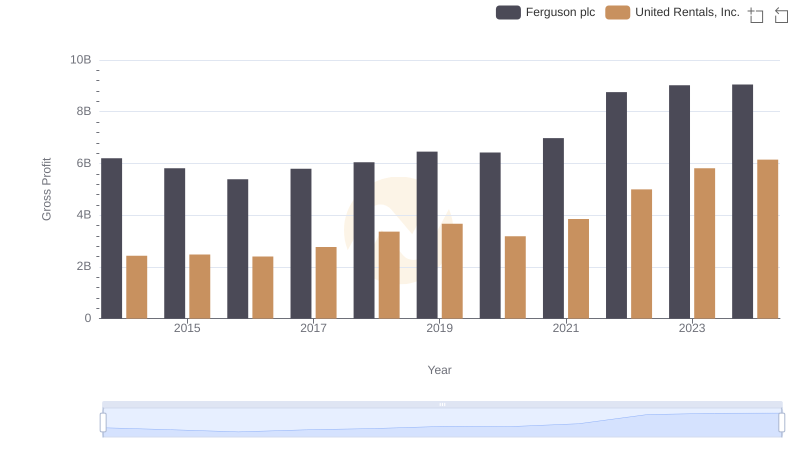
Key Insights on Gross Profit: United Rentals, Inc. vs Ferguson plc
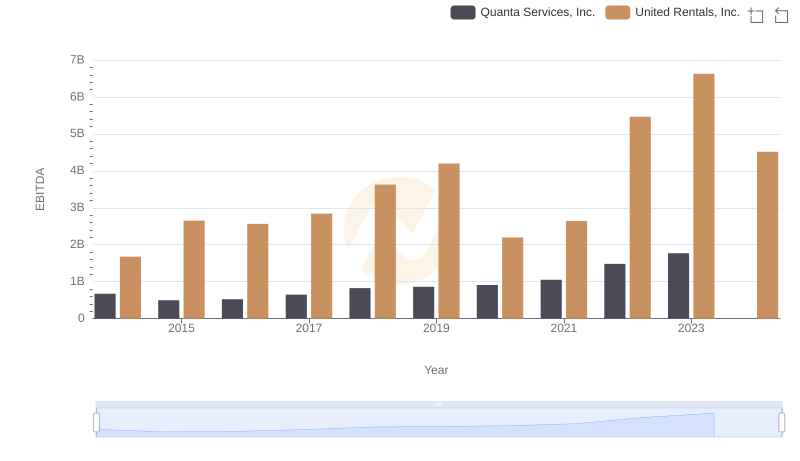
Comprehensive EBITDA Comparison: United Rentals, Inc. vs Quanta Services, Inc.
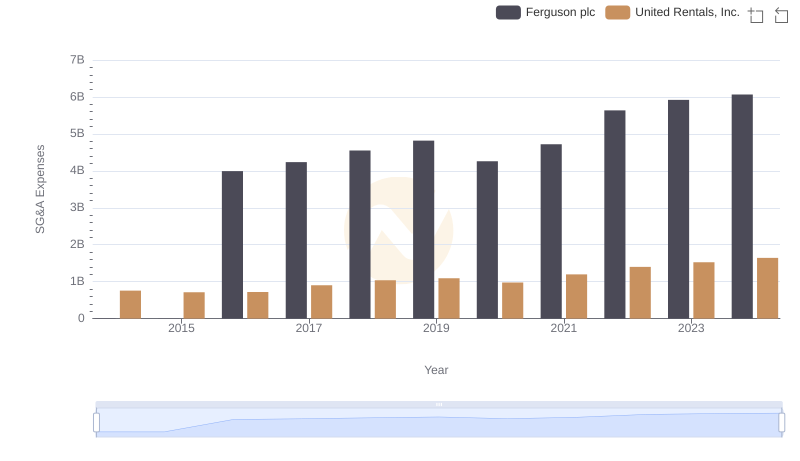
Comparing SG&A Expenses: United Rentals, Inc. vs Ferguson plc Trends and Insights
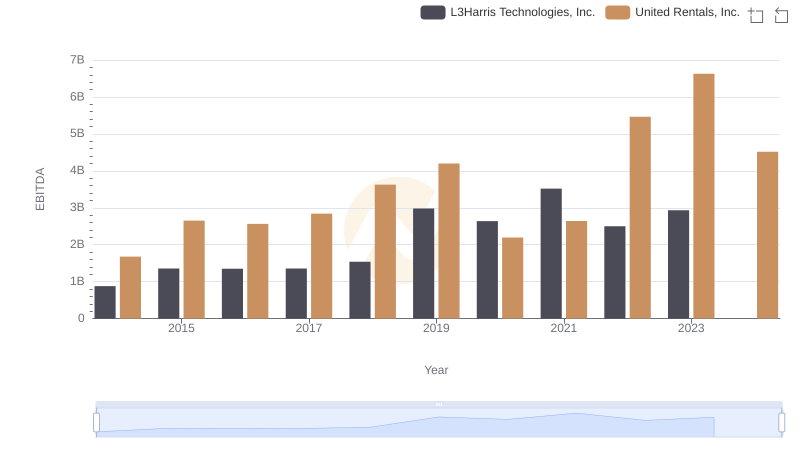
A Professional Review of EBITDA: United Rentals, Inc. Compared to L3Harris Technologies, Inc.
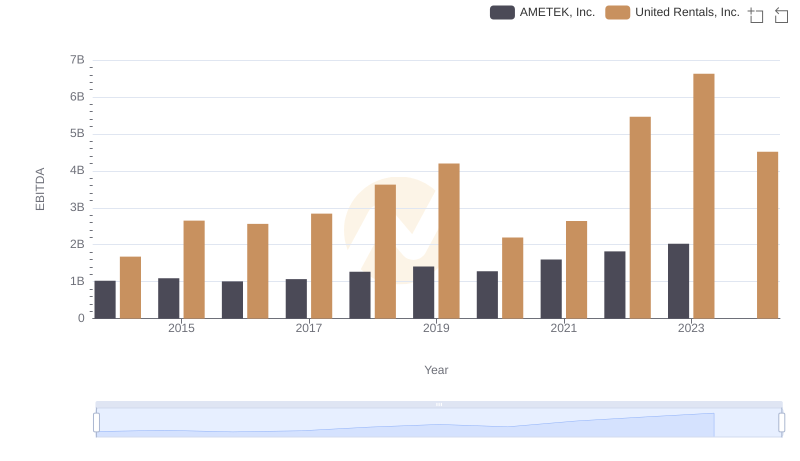
A Side-by-Side Analysis of EBITDA: United Rentals, Inc. and AMETEK, Inc.
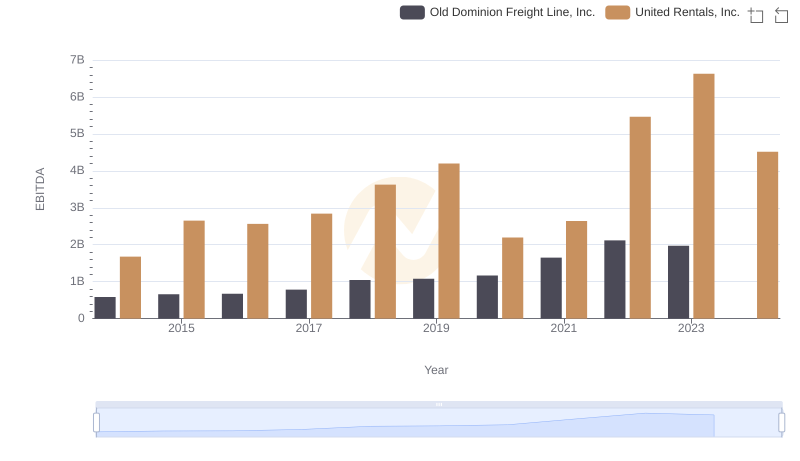
Professional EBITDA Benchmarking: United Rentals, Inc. vs Old Dominion Freight Line, Inc.
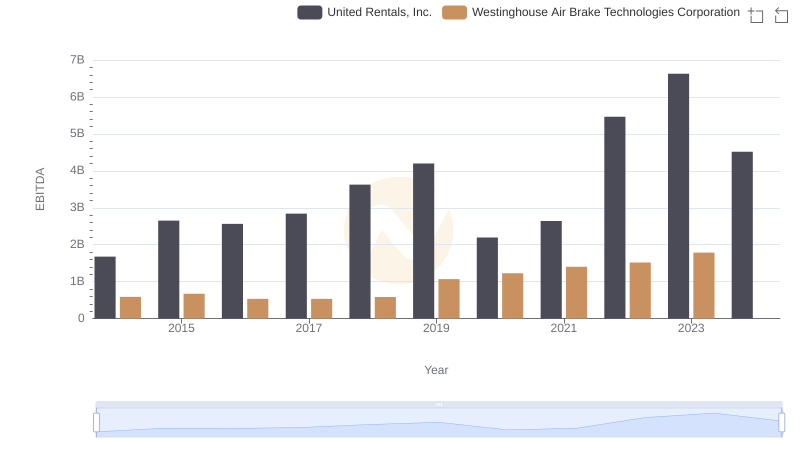
EBITDA Analysis: Evaluating United Rentals, Inc. Against Westinghouse Air Brake Technologies Corporation
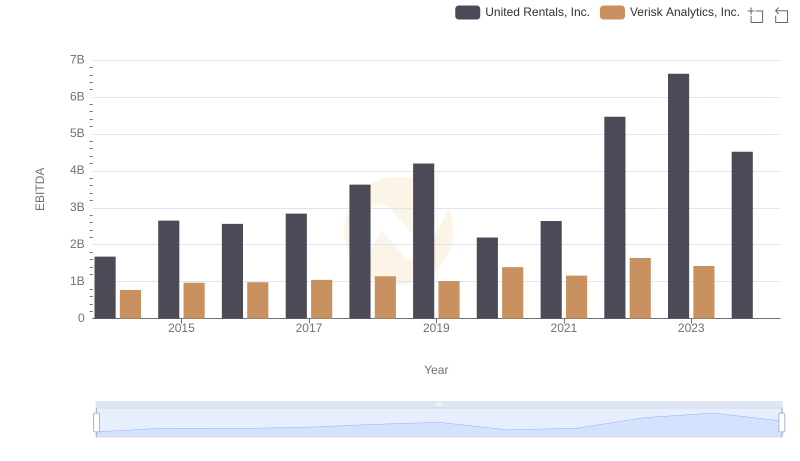
United Rentals, Inc. and Verisk Analytics, Inc.: A Detailed Examination of EBITDA Performance
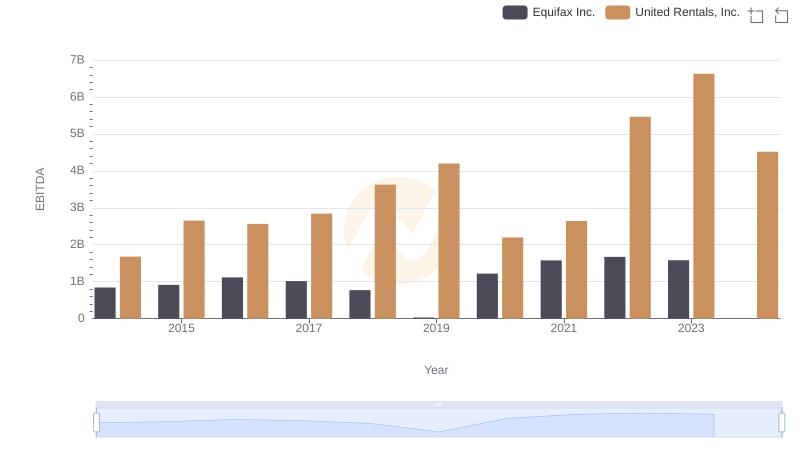
EBITDA Performance Review: United Rentals, Inc. vs Equifax Inc.
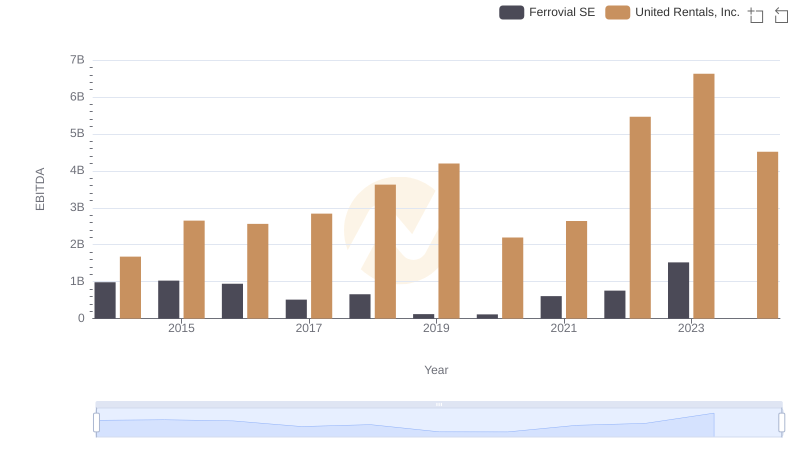
United Rentals, Inc. vs Ferrovial SE: In-Depth EBITDA Performance Comparison