| __timestamp | Ferguson plc | United Rentals, Inc. |
|---|---|---|
| Wednesday, January 1, 2014 | 22198928094 | 5685000000 |
| Thursday, January 1, 2015 | 20800698973 | 5817000000 |
| Friday, January 1, 2016 | 19066872795 | 5762000000 |
| Sunday, January 1, 2017 | 20009463224 | 6641000000 |
| Monday, January 1, 2018 | 20752000000 | 8047000000 |
| Tuesday, January 1, 2019 | 22010000000 | 9351000000 |
| Wednesday, January 1, 2020 | 21819000000 | 8530000000 |
| Friday, January 1, 2021 | 22792000000 | 9716000000 |
| Saturday, January 1, 2022 | 28566000000 | 11642000000 |
| Sunday, January 1, 2023 | 29734000000 | 14332000000 |
| Monday, January 1, 2024 | 29635000000 | 15345000000 |
Unveiling the hidden dimensions of data
In the competitive landscape of industrial services, United Rentals, Inc. and Ferguson plc have been vying for the top spot in yearly revenue. Over the past decade, Ferguson plc has consistently outpaced United Rentals, boasting a revenue growth of approximately 34% from 2014 to 2024. In contrast, United Rentals has shown a remarkable growth trajectory, with its revenue more than doubling in the same period, reflecting a robust 170% increase.
From 2014 to 2024, Ferguson plc's revenue peaked in 2023 at nearly $30 billion, while United Rentals reached its highest in 2024 with over $15 billion. This growth highlights United Rentals' aggressive expansion strategy, closing the gap with Ferguson. As the industry evolves, both companies continue to innovate and expand, setting the stage for an exciting future in industrial services.
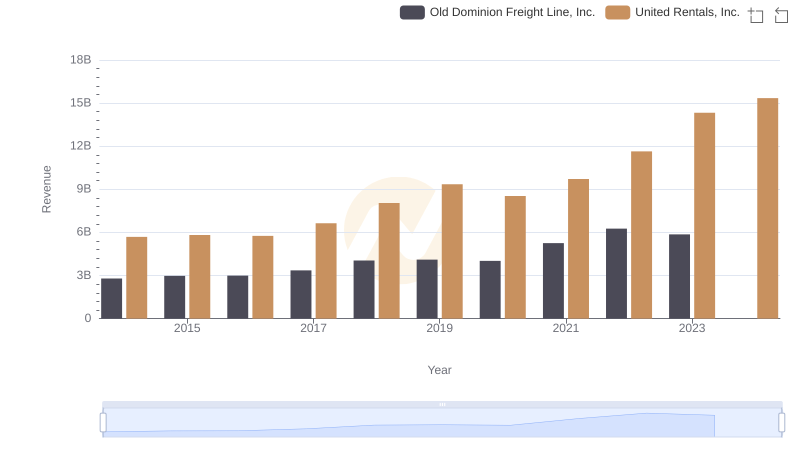
Who Generates More Revenue? United Rentals, Inc. or Old Dominion Freight Line, Inc.
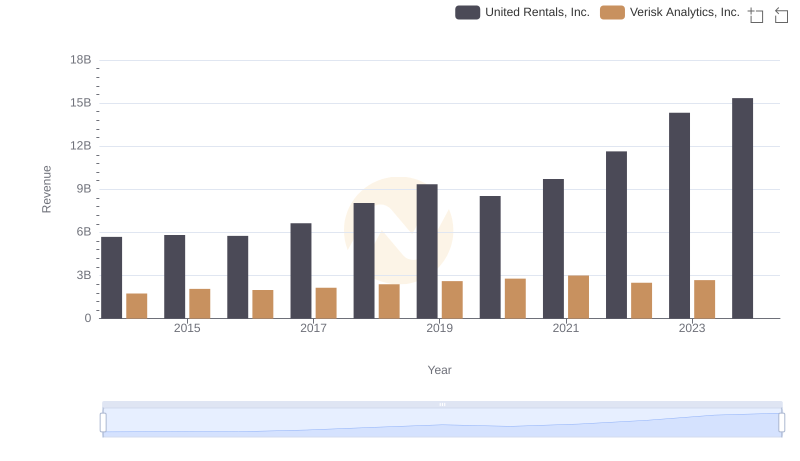
Revenue Insights: United Rentals, Inc. and Verisk Analytics, Inc. Performance Compared
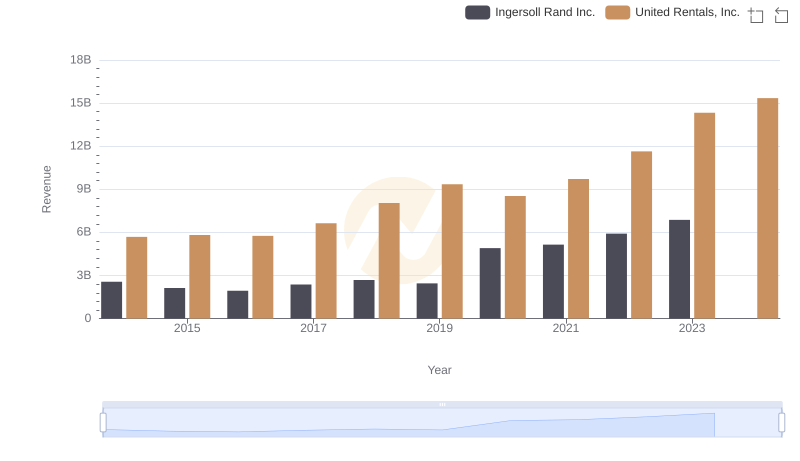
United Rentals, Inc. vs Ingersoll Rand Inc.: Examining Key Revenue Metrics
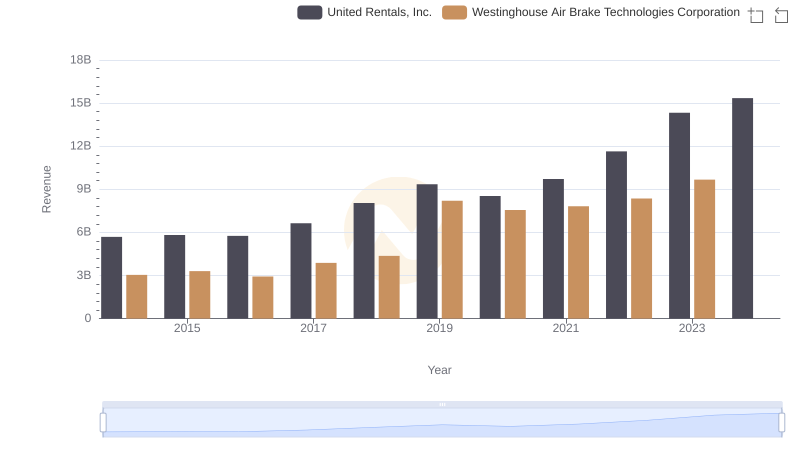
United Rentals, Inc. and Westinghouse Air Brake Technologies Corporation: A Comprehensive Revenue Analysis
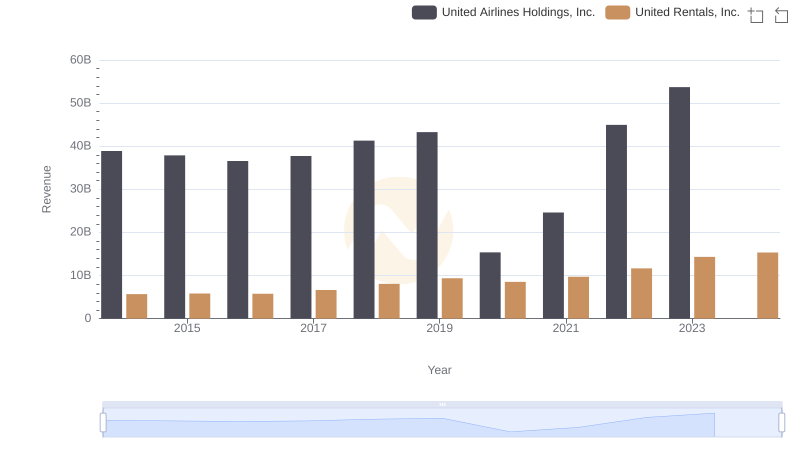
United Rentals, Inc. vs United Airlines Holdings, Inc.: Examining Key Revenue Metrics
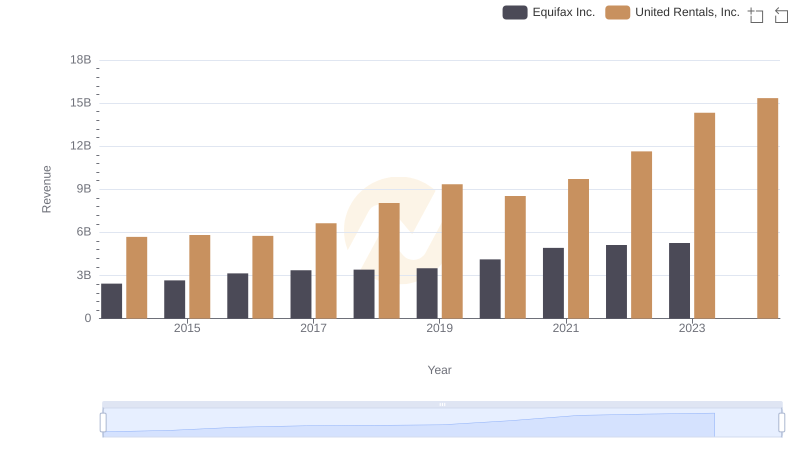
United Rentals, Inc. vs Equifax Inc.: Annual Revenue Growth Compared
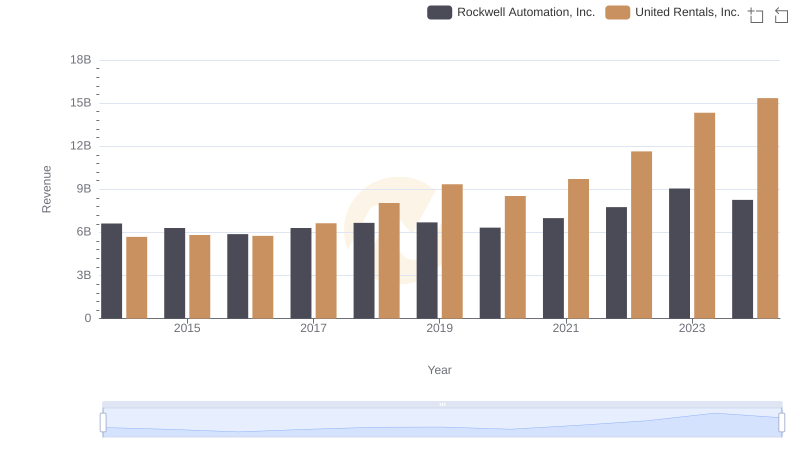
Annual Revenue Comparison: United Rentals, Inc. vs Rockwell Automation, Inc.
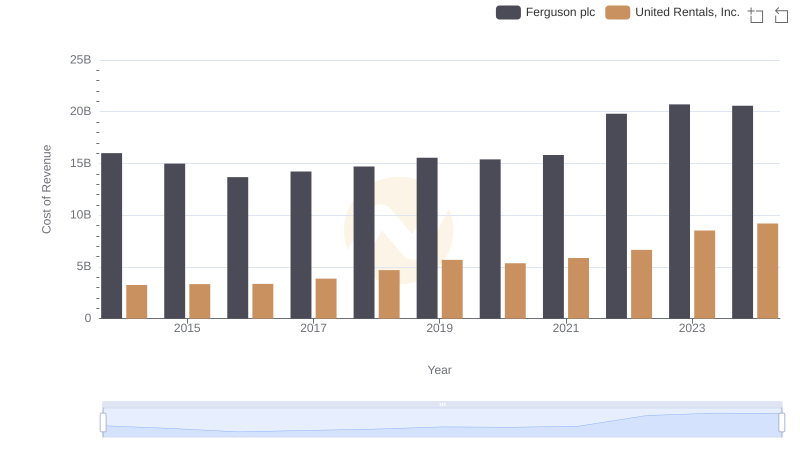
Cost of Revenue Comparison: United Rentals, Inc. vs Ferguson plc
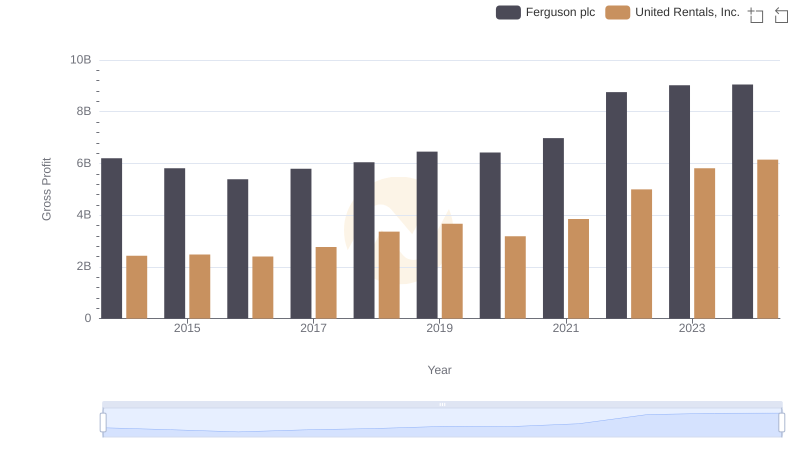
Key Insights on Gross Profit: United Rentals, Inc. vs Ferguson plc
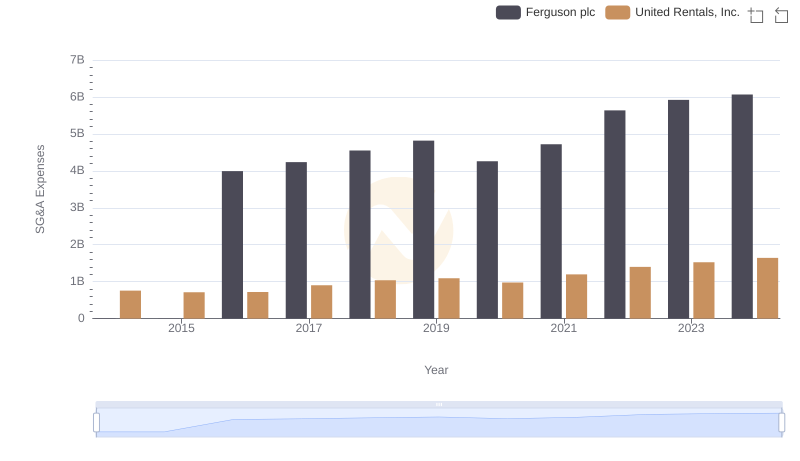
Comparing SG&A Expenses: United Rentals, Inc. vs Ferguson plc Trends and Insights
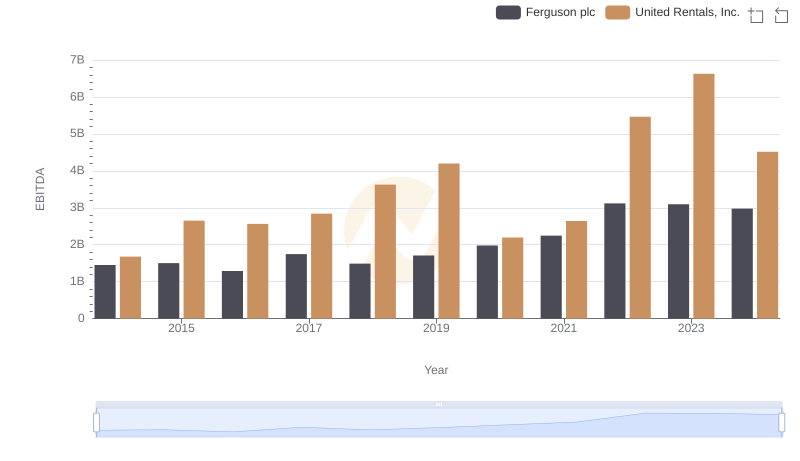
Comprehensive EBITDA Comparison: United Rentals, Inc. vs Ferguson plc