| __timestamp | Allegion plc | United Airlines Holdings, Inc. |
|---|---|---|
| Wednesday, January 1, 2014 | 1264600000 | 29569000000 |
| Thursday, January 1, 2015 | 1199000000 | 25952000000 |
| Friday, January 1, 2016 | 1252700000 | 24856000000 |
| Sunday, January 1, 2017 | 1337500000 | 27056000000 |
| Monday, January 1, 2018 | 1558400000 | 30165000000 |
| Tuesday, January 1, 2019 | 1601700000 | 30786000000 |
| Wednesday, January 1, 2020 | 1541100000 | 20385000000 |
| Friday, January 1, 2021 | 1662500000 | 23913000000 |
| Saturday, January 1, 2022 | 1949500000 | 34315000000 |
| Sunday, January 1, 2023 | 2069300000 | 38518000000 |
| Monday, January 1, 2024 | 2103700000 | 37643000000 |
Unlocking the unknown
In the ever-evolving landscape of corporate efficiency, the cost of revenue serves as a critical metric for evaluating a company's operational prowess. This analysis juxtaposes United Airlines Holdings, Inc., a titan in the aviation industry, against Allegion plc, a leader in security solutions, from 2014 to 2023.
United Airlines, with its vast operational scale, consistently reported a cost of revenue that dwarfed Allegion's, peaking at approximately $38.5 billion in 2023. Despite the aviation industry's challenges, including the 2020 downturn, United Airlines demonstrated resilience with a 90% recovery in cost efficiency by 2023.
Conversely, Allegion plc showcased steady growth, with its cost of revenue increasing by 64% over the same period, reflecting its strategic expansion in the security sector. This comparison highlights the diverse challenges and strategies across industries, offering valuable insights into operational efficiency.
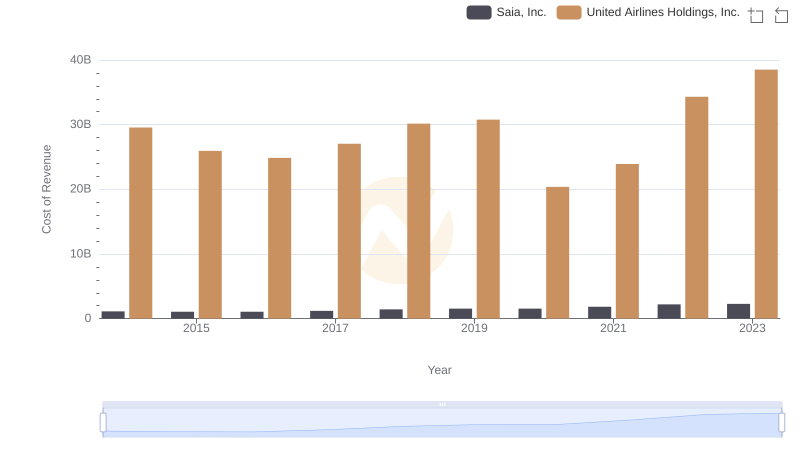
Comparing Cost of Revenue Efficiency: United Airlines Holdings, Inc. vs Saia, Inc.
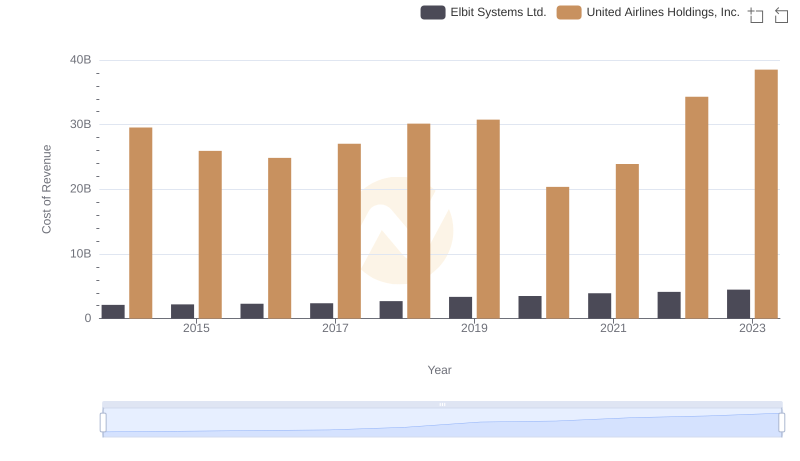
Cost Insights: Breaking Down United Airlines Holdings, Inc. and Elbit Systems Ltd.'s Expenses
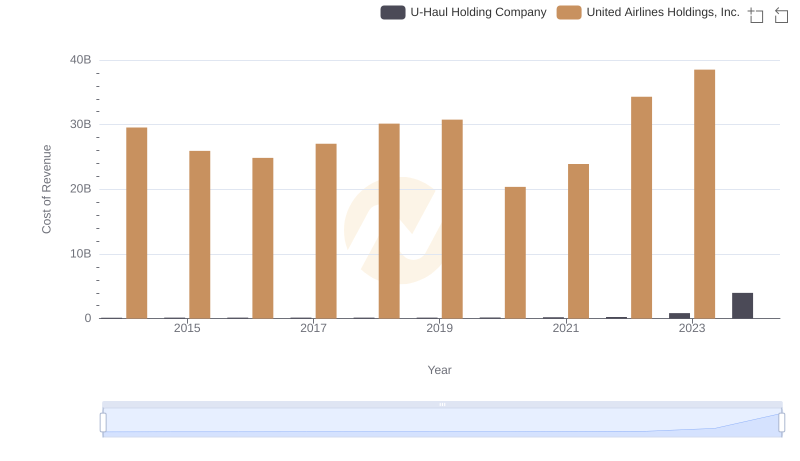
Cost of Revenue: Key Insights for United Airlines Holdings, Inc. and U-Haul Holding Company
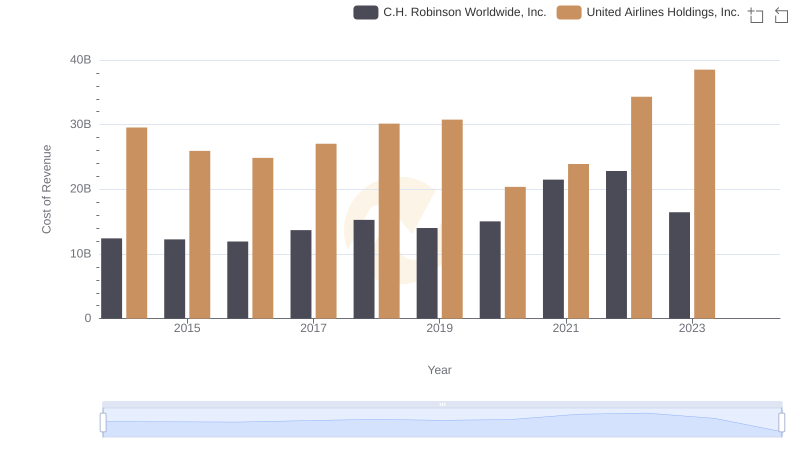
Cost of Revenue Comparison: United Airlines Holdings, Inc. vs C.H. Robinson Worldwide, Inc.
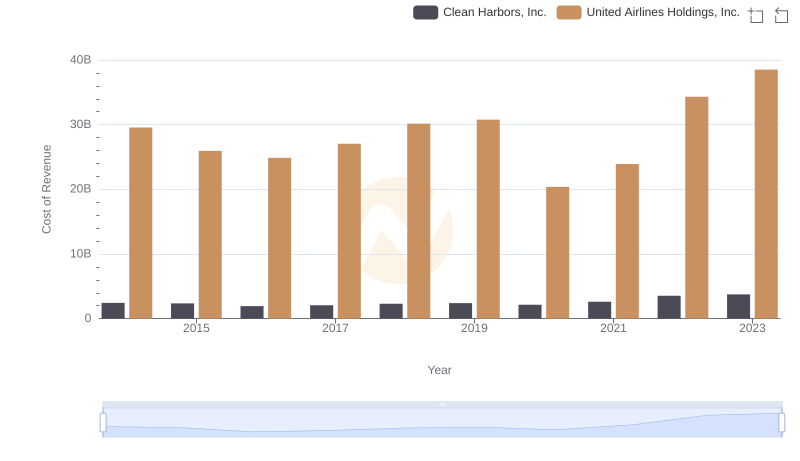
Cost Insights: Breaking Down United Airlines Holdings, Inc. and Clean Harbors, Inc.'s Expenses
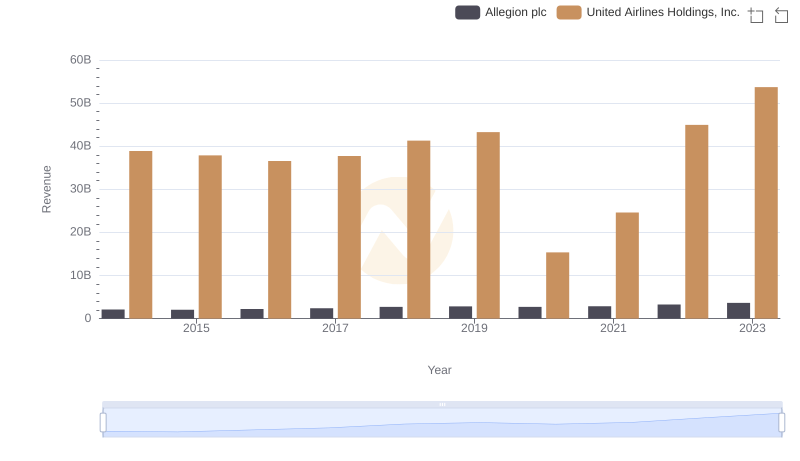
United Airlines Holdings, Inc. and Allegion plc: A Comprehensive Revenue Analysis
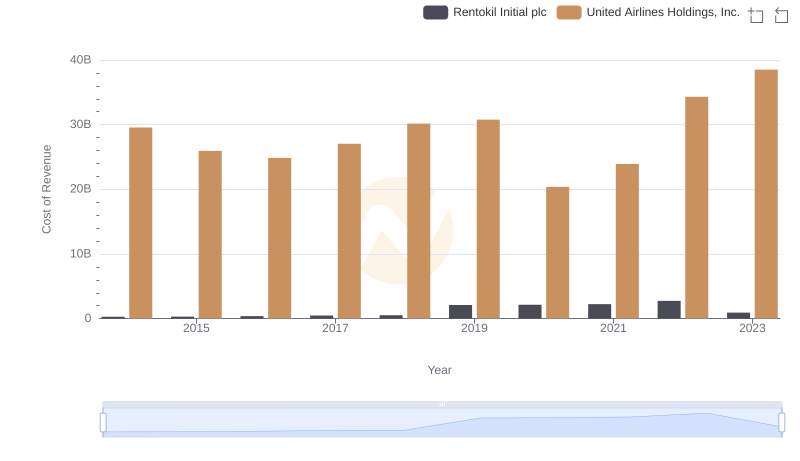
Comparing Cost of Revenue Efficiency: United Airlines Holdings, Inc. vs Rentokil Initial plc
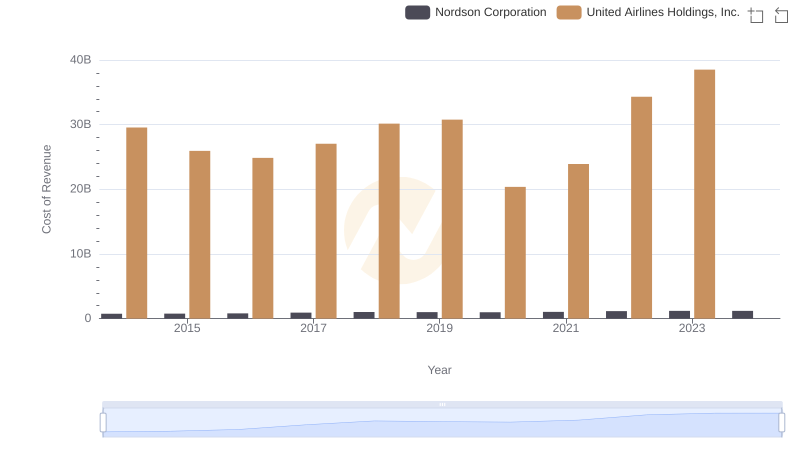
Comparing Cost of Revenue Efficiency: United Airlines Holdings, Inc. vs Nordson Corporation
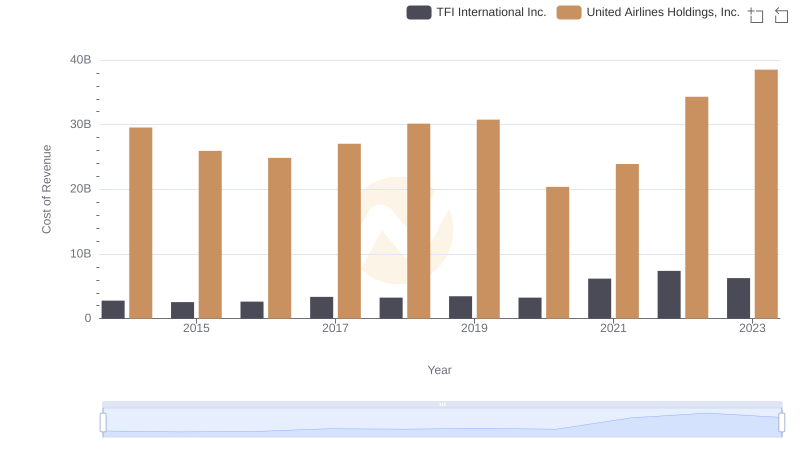
Cost of Revenue Comparison: United Airlines Holdings, Inc. vs TFI International Inc.
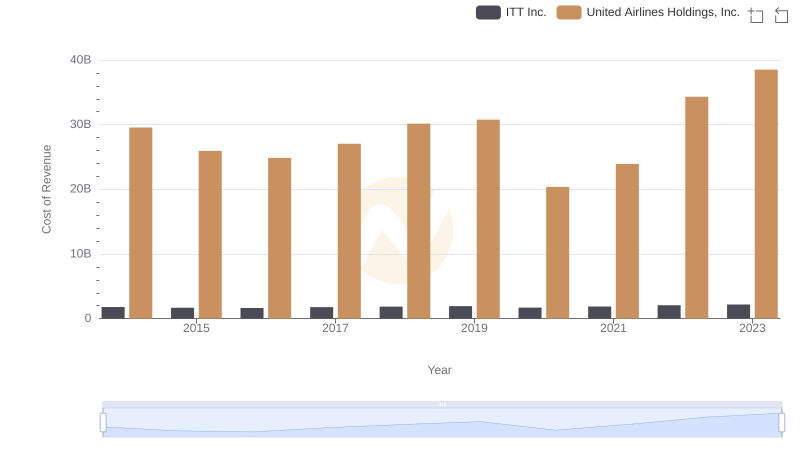
Analyzing Cost of Revenue: United Airlines Holdings, Inc. and ITT Inc.
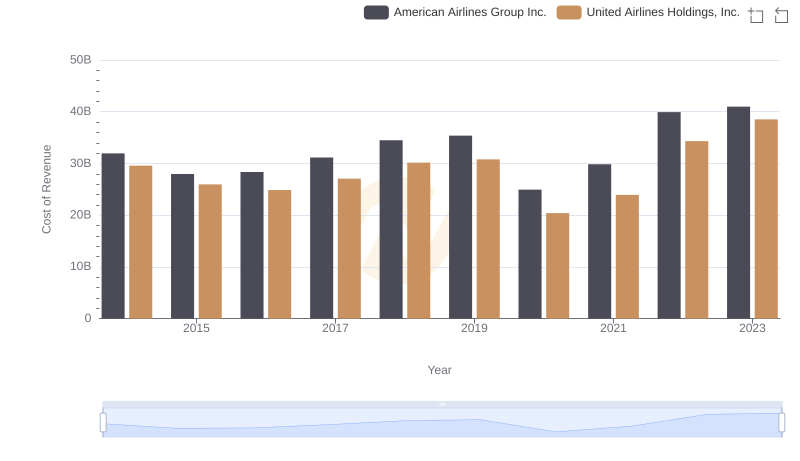
Cost Insights: Breaking Down United Airlines Holdings, Inc. and American Airlines Group Inc.'s Expenses