| __timestamp | Ferrovial SE | Trane Technologies plc |
|---|---|---|
| Wednesday, January 1, 2014 | 1131000000 | 8982800000 |
| Thursday, January 1, 2015 | 1143000000 | 9301600000 |
| Friday, January 1, 2016 | 1267000000 | 9329300000 |
| Sunday, January 1, 2017 | 1345000000 | 9811600000 |
| Monday, January 1, 2018 | 985000000 | 10847600000 |
| Tuesday, January 1, 2019 | 949000000 | 11451500000 |
| Wednesday, January 1, 2020 | 1005000000 | 8651300000 |
| Friday, January 1, 2021 | 1077000000 | 9666800000 |
| Saturday, January 1, 2022 | 1197000000 | 11026900000 |
| Sunday, January 1, 2023 | 1129000000 | 11820400000 |
| Monday, January 1, 2024 | 12757700000 |
Cracking the code
In the ever-evolving landscape of global business, understanding the cost of revenue is crucial for evaluating a company's efficiency and profitability. This comparison between Trane Technologies plc and Ferrovial SE offers a fascinating glimpse into their financial journeys from 2014 to 2023.
Trane Technologies, a leader in climate innovation, has shown a consistent upward trend in its cost of revenue. From 2014 to 2023, the company experienced a remarkable 32% increase, peaking in 2023. This growth reflects Trane's expanding operations and its commitment to sustainable solutions.
Meanwhile, Ferrovial SE, a global infrastructure operator, faced a more fluctuating path. Despite a 19% dip in 2018, the company rebounded, achieving a 13% increase by 2023. This resilience underscores Ferrovial's adaptability in a competitive market.
Both companies exemplify strategic financial management, offering valuable insights for investors and industry analysts alike.
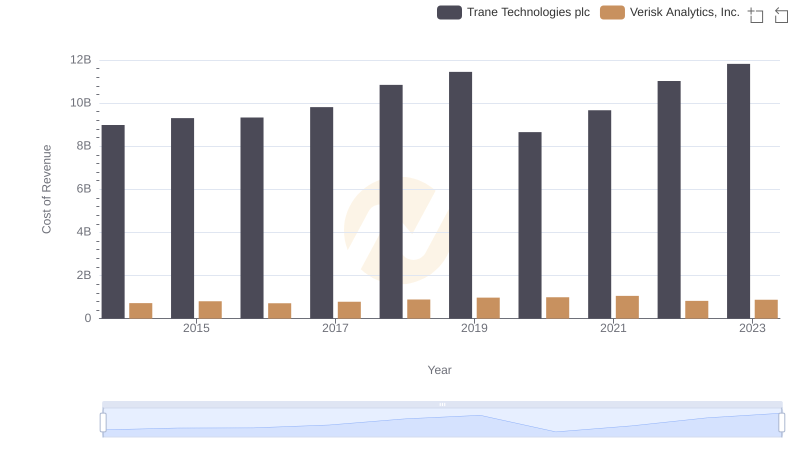
Cost of Revenue Trends: Trane Technologies plc vs Verisk Analytics, Inc.
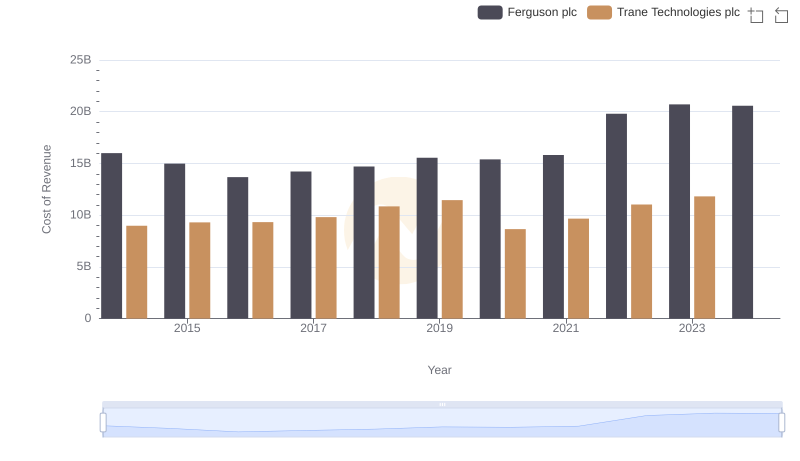
Analyzing Cost of Revenue: Trane Technologies plc and Ferguson plc
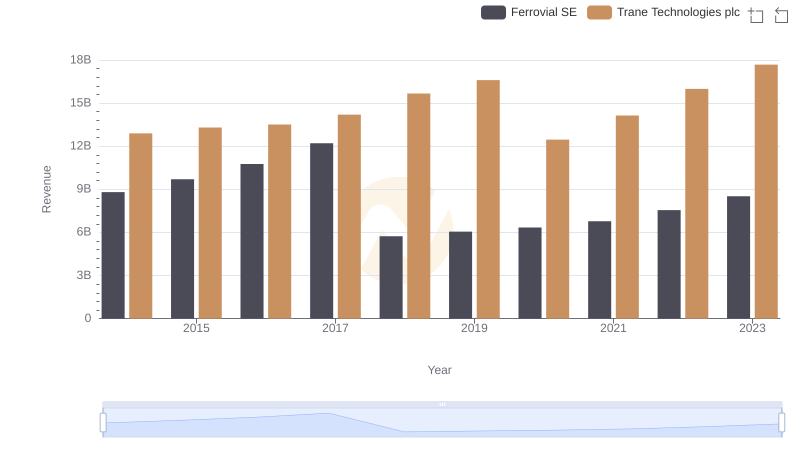
Comparing Revenue Performance: Trane Technologies plc or Ferrovial SE?

Cost of Revenue Comparison: Trane Technologies plc vs Westinghouse Air Brake Technologies Corporation
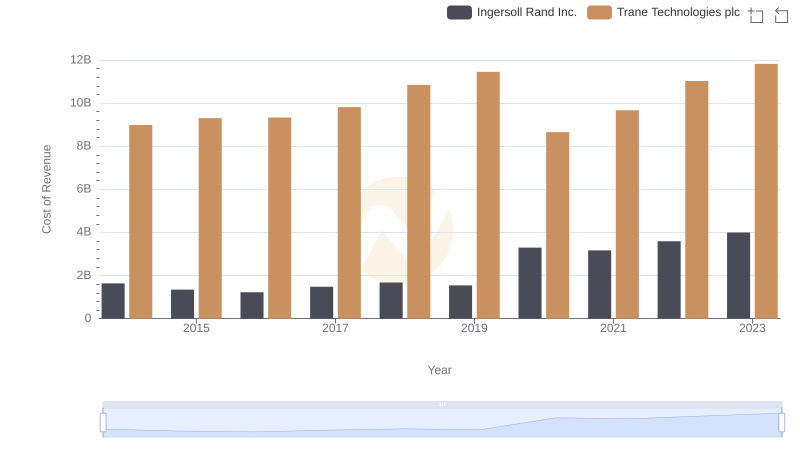
Cost of Revenue Comparison: Trane Technologies plc vs Ingersoll Rand Inc.

Comparing Cost of Revenue Efficiency: Trane Technologies plc vs United Airlines Holdings, Inc.
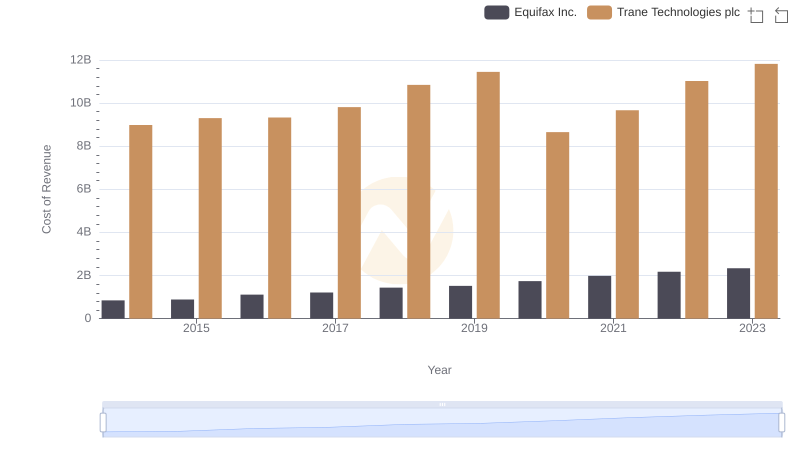
Cost of Revenue Comparison: Trane Technologies plc vs Equifax Inc.
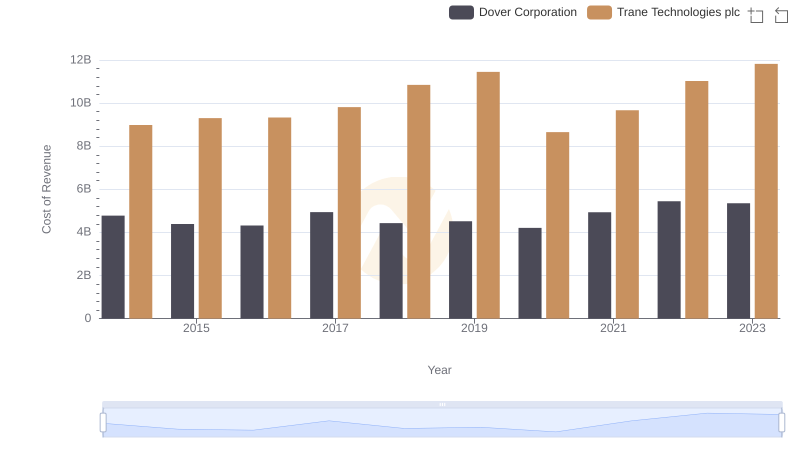
Cost of Revenue: Key Insights for Trane Technologies plc and Dover Corporation
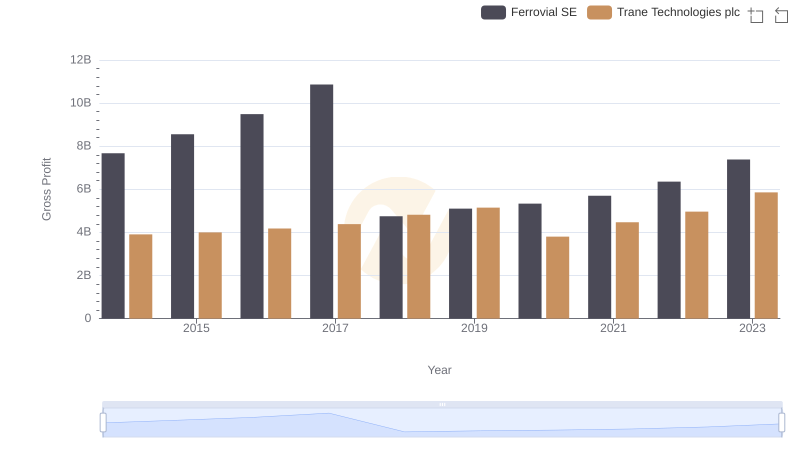
Trane Technologies plc vs Ferrovial SE: A Gross Profit Performance Breakdown
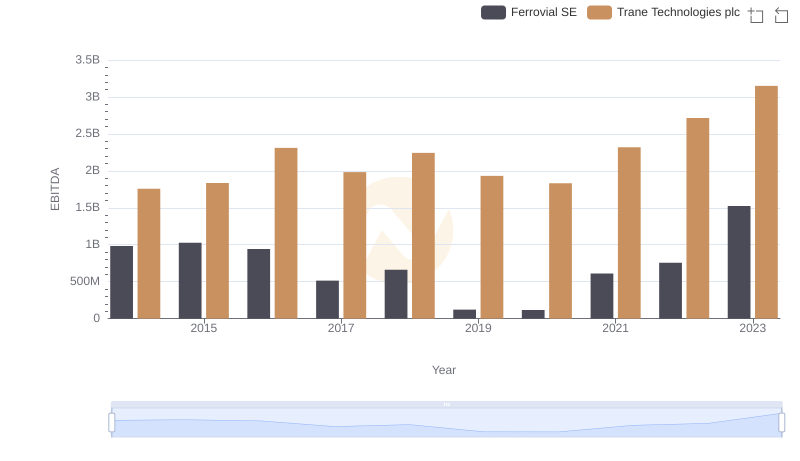
Professional EBITDA Benchmarking: Trane Technologies plc vs Ferrovial SE