| __timestamp | Ferrovial SE | Trane Technologies plc |
|---|---|---|
| Wednesday, January 1, 2014 | 8802000000 | 12891400000 |
| Thursday, January 1, 2015 | 9699000000 | 13300700000 |
| Friday, January 1, 2016 | 10758000000 | 13508900000 |
| Sunday, January 1, 2017 | 12209000000 | 14197600000 |
| Monday, January 1, 2018 | 5737000000 | 15668200000 |
| Tuesday, January 1, 2019 | 6054000000 | 16598900000 |
| Wednesday, January 1, 2020 | 6341000000 | 12454700000 |
| Friday, January 1, 2021 | 6778000000 | 14136400000 |
| Saturday, January 1, 2022 | 7551000000 | 15991700000 |
| Sunday, January 1, 2023 | 8514000000 | 17677600000 |
| Monday, January 1, 2024 | 19838200000 |
Unlocking the unknown
In the ever-evolving landscape of global business, revenue performance is a key indicator of a company's success. This analysis delves into the annual revenue trends of Trane Technologies plc and Ferrovial SE from 2014 to 2023. Over this period, Trane Technologies has consistently outperformed Ferrovial SE, with an average revenue of approximately $14.6 billion, compared to Ferrovial's $8.2 billion. Notably, Trane Technologies saw a remarkable 37% increase in revenue from 2014 to 2023, peaking at $17.7 billion in 2023. In contrast, Ferrovial SE experienced a more modest growth of around 3% over the same period, with revenues fluctuating significantly, particularly in 2018 when they dropped to $5.7 billion. This comparison highlights Trane Technologies' robust growth trajectory, while Ferrovial SE's revenue reflects a more volatile market presence.
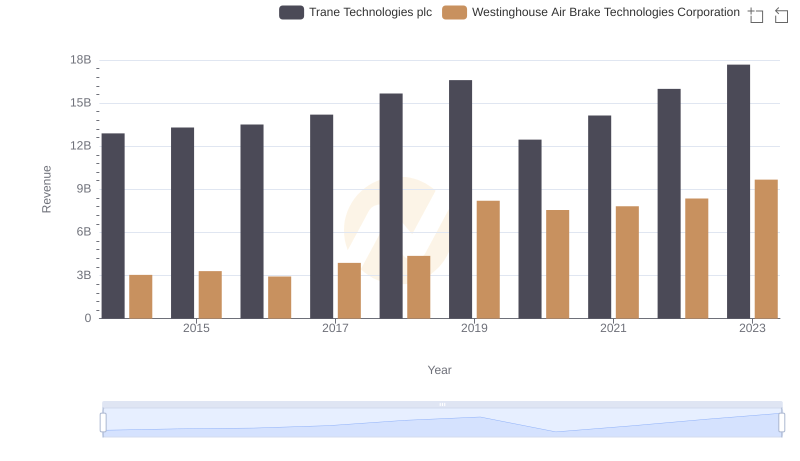
Trane Technologies plc vs Westinghouse Air Brake Technologies Corporation: Examining Key Revenue Metrics
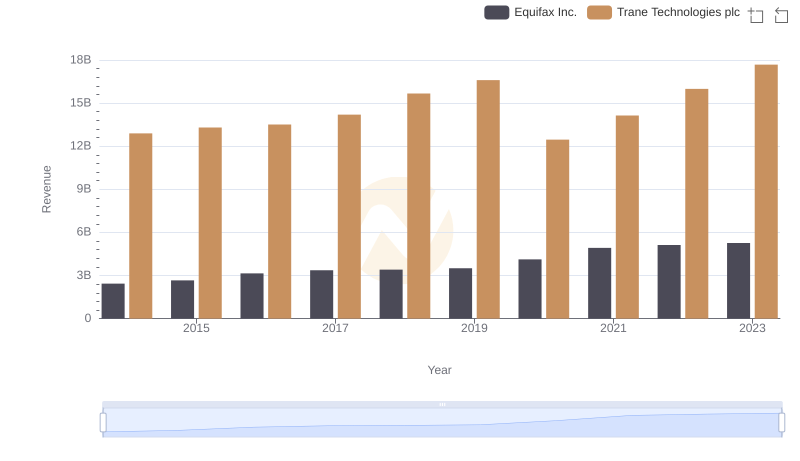
Comparing Revenue Performance: Trane Technologies plc or Equifax Inc.?
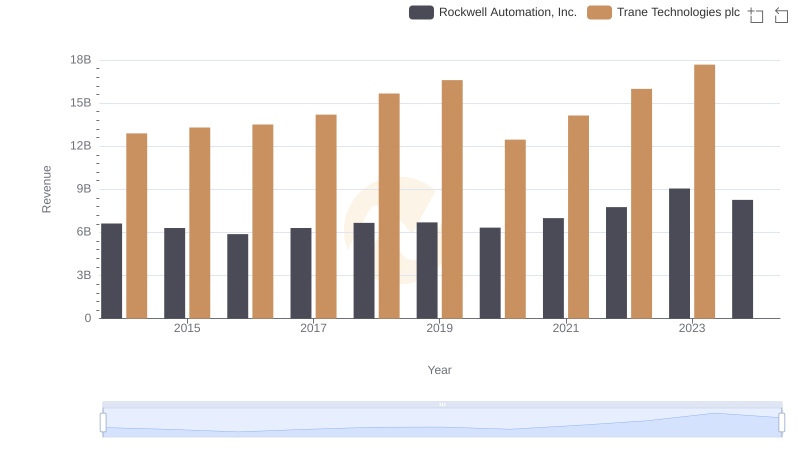
Trane Technologies plc or Rockwell Automation, Inc.: Who Leads in Yearly Revenue?
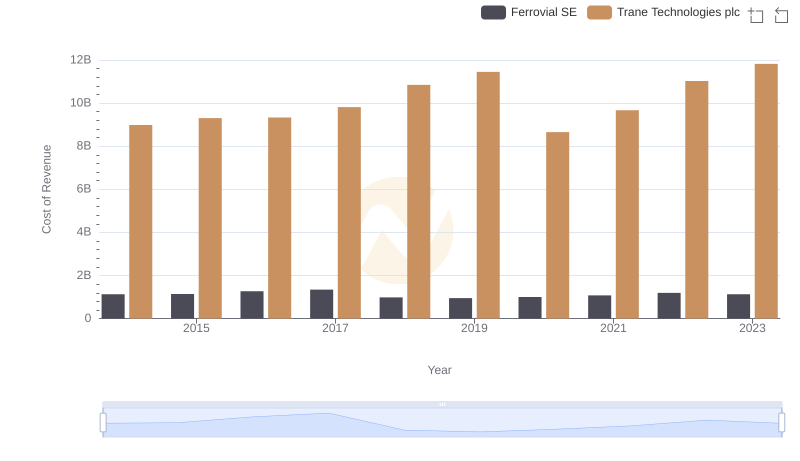
Cost of Revenue Comparison: Trane Technologies plc vs Ferrovial SE
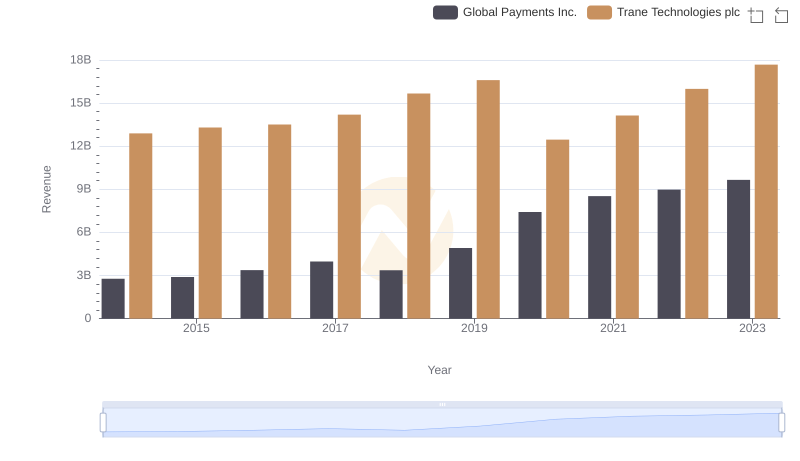
Trane Technologies plc and Global Payments Inc.: A Comprehensive Revenue Analysis
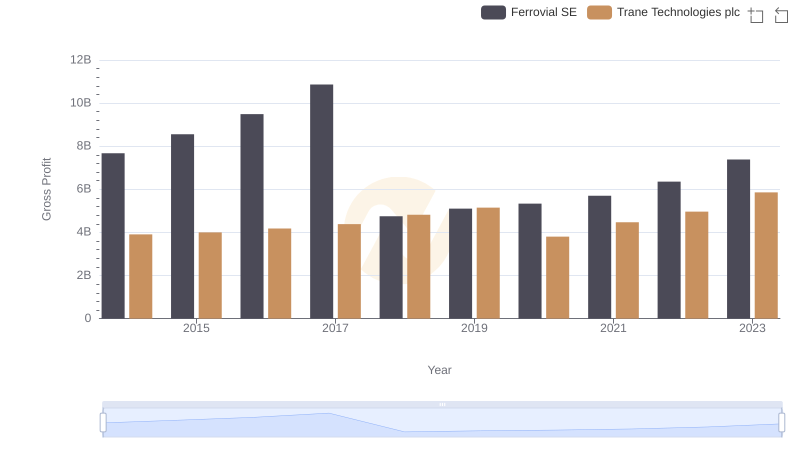
Trane Technologies plc vs Ferrovial SE: A Gross Profit Performance Breakdown
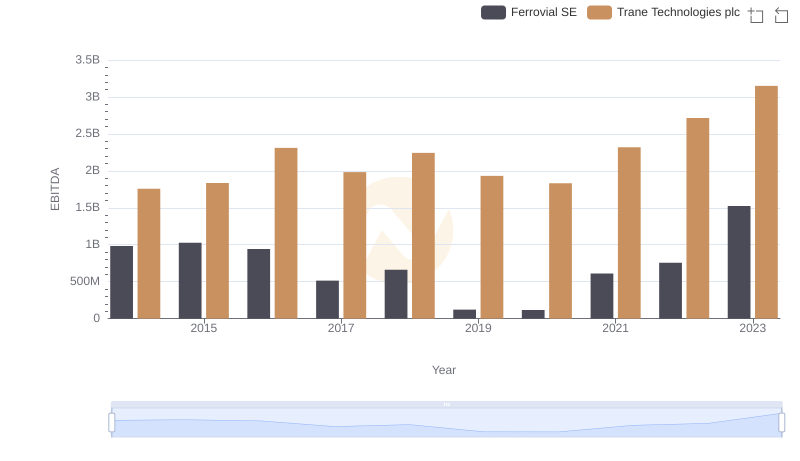
Professional EBITDA Benchmarking: Trane Technologies plc vs Ferrovial SE