| __timestamp | Trane Technologies plc | Westinghouse Air Brake Technologies Corporation |
|---|---|---|
| Wednesday, January 1, 2014 | 8982800000 | 2130920000 |
| Thursday, January 1, 2015 | 9301600000 | 2281845000 |
| Friday, January 1, 2016 | 9329300000 | 2029647000 |
| Sunday, January 1, 2017 | 9811600000 | 2841159000 |
| Monday, January 1, 2018 | 10847600000 | 3151816000 |
| Tuesday, January 1, 2019 | 11451500000 | 6122400000 |
| Wednesday, January 1, 2020 | 8651300000 | 5657400000 |
| Friday, January 1, 2021 | 9666800000 | 5687000000 |
| Saturday, January 1, 2022 | 11026900000 | 6070000000 |
| Sunday, January 1, 2023 | 11820400000 | 6733000000 |
| Monday, January 1, 2024 | 12757700000 | 7021000000 |
In pursuit of knowledge
In the ever-evolving industrial landscape, understanding cost structures is pivotal. Over the past decade, Trane Technologies plc and Westinghouse Air Brake Technologies Corporation have showcased distinct cost of revenue trends. Trane Technologies, a leader in climate solutions, has seen its cost of revenue grow by approximately 32% from 2014 to 2023, peaking in 2023. This reflects its strategic investments in sustainable technologies. Meanwhile, Westinghouse Air Brake, a key player in rail technology, experienced a staggering 216% increase in cost of revenue during the same period, highlighting its aggressive expansion and innovation in rail systems. Notably, 2019 marked a significant surge for Westinghouse, with costs jumping by nearly 94% from the previous year. These trends underscore the companies' differing strategies in navigating market demands and technological advancements.
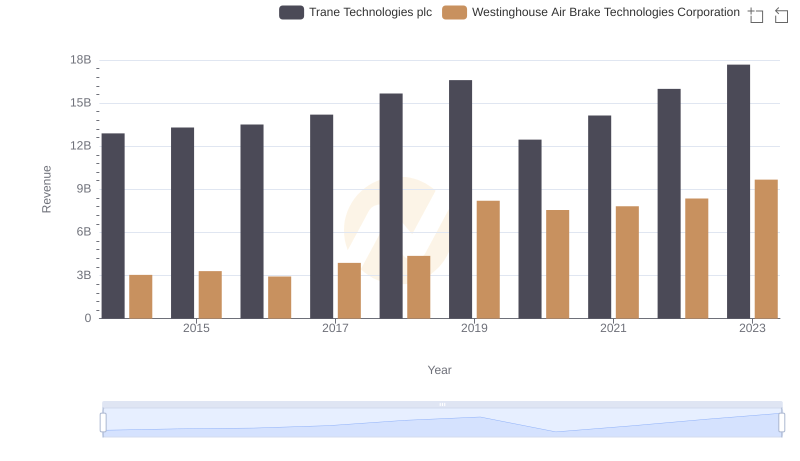
Trane Technologies plc vs Westinghouse Air Brake Technologies Corporation: Examining Key Revenue Metrics
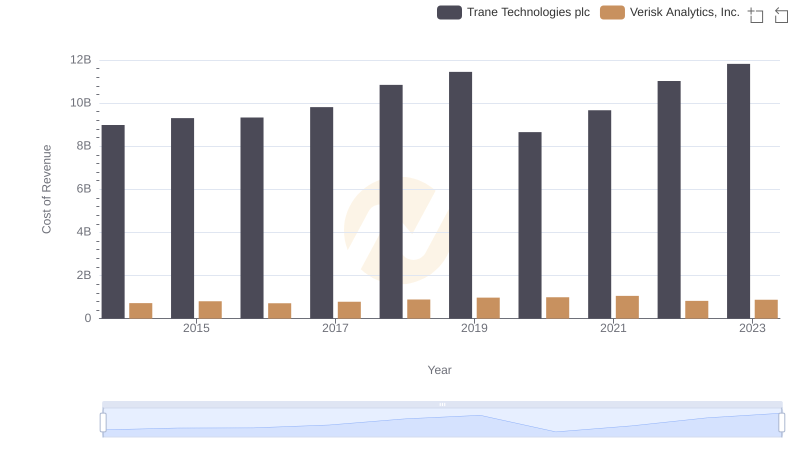
Cost of Revenue Trends: Trane Technologies plc vs Verisk Analytics, Inc.
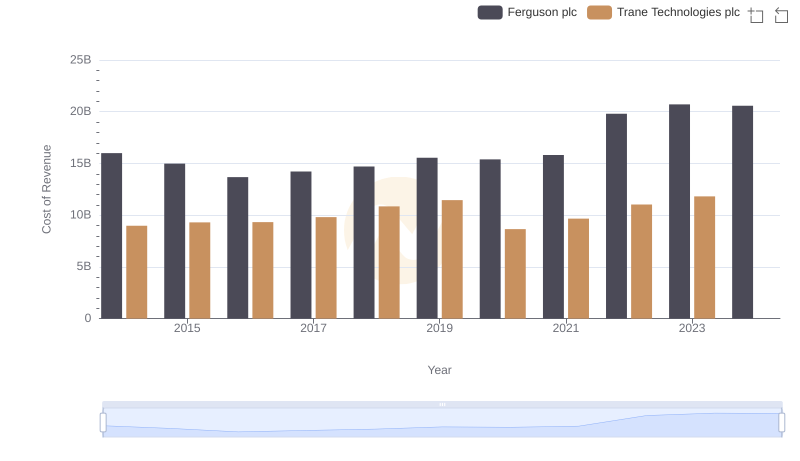
Analyzing Cost of Revenue: Trane Technologies plc and Ferguson plc
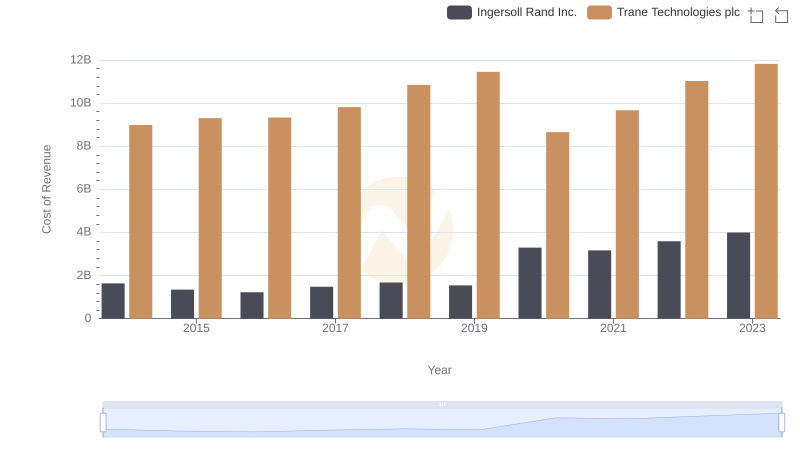
Cost of Revenue Comparison: Trane Technologies plc vs Ingersoll Rand Inc.

Comparing Cost of Revenue Efficiency: Trane Technologies plc vs United Airlines Holdings, Inc.
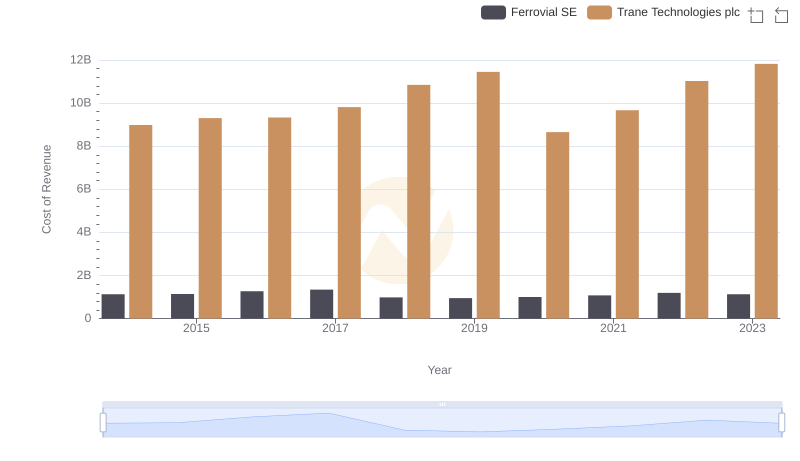
Cost of Revenue Comparison: Trane Technologies plc vs Ferrovial SE
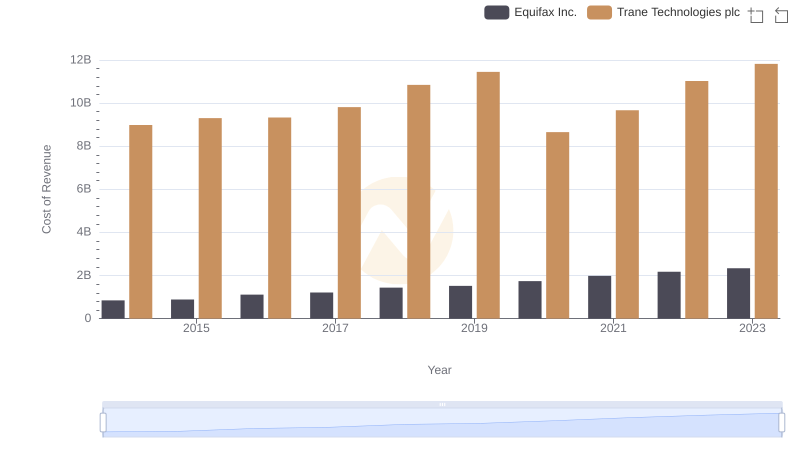
Cost of Revenue Comparison: Trane Technologies plc vs Equifax Inc.
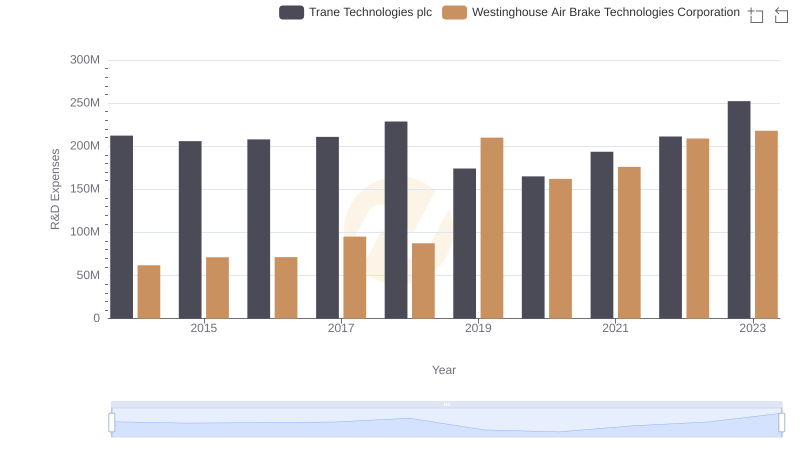
Who Prioritizes Innovation? R&D Spending Compared for Trane Technologies plc and Westinghouse Air Brake Technologies Corporation
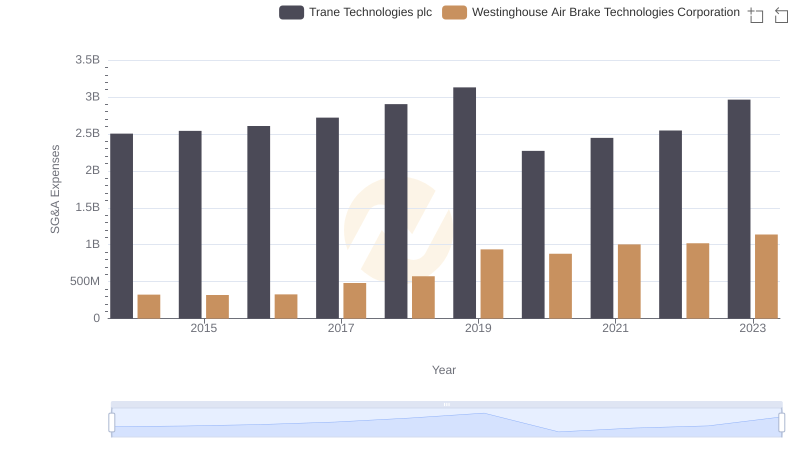
Trane Technologies plc and Westinghouse Air Brake Technologies Corporation: SG&A Spending Patterns Compared
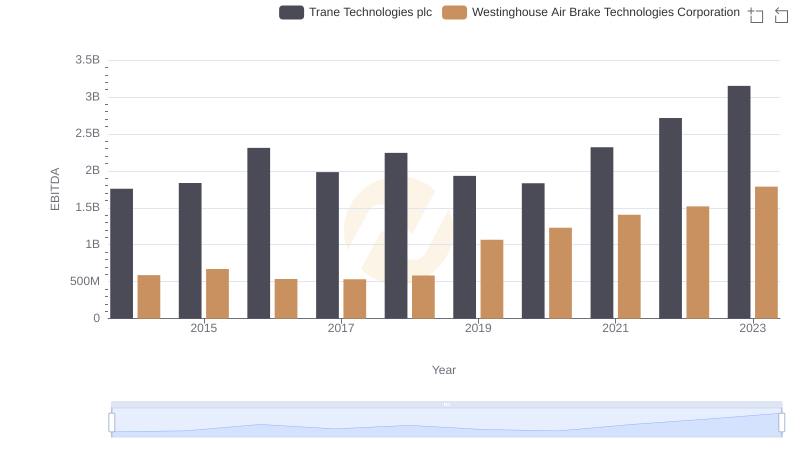
EBITDA Analysis: Evaluating Trane Technologies plc Against Westinghouse Air Brake Technologies Corporation