| __timestamp | Ferrovial SE | Trane Technologies plc |
|---|---|---|
| Wednesday, January 1, 2014 | 7671000000 | 3908600000 |
| Thursday, January 1, 2015 | 8556000000 | 3999100000 |
| Friday, January 1, 2016 | 9491000000 | 4179600000 |
| Sunday, January 1, 2017 | 10864000000 | 4386000000 |
| Monday, January 1, 2018 | 4752000000 | 4820600000 |
| Tuesday, January 1, 2019 | 5105000000 | 5147400000 |
| Wednesday, January 1, 2020 | 5336000000 | 3803400000 |
| Friday, January 1, 2021 | 5701000000 | 4469600000 |
| Saturday, January 1, 2022 | 6354000000 | 4964800000 |
| Sunday, January 1, 2023 | 7385000000 | 5857200000 |
| Monday, January 1, 2024 | 7080500000 |
Cracking the code
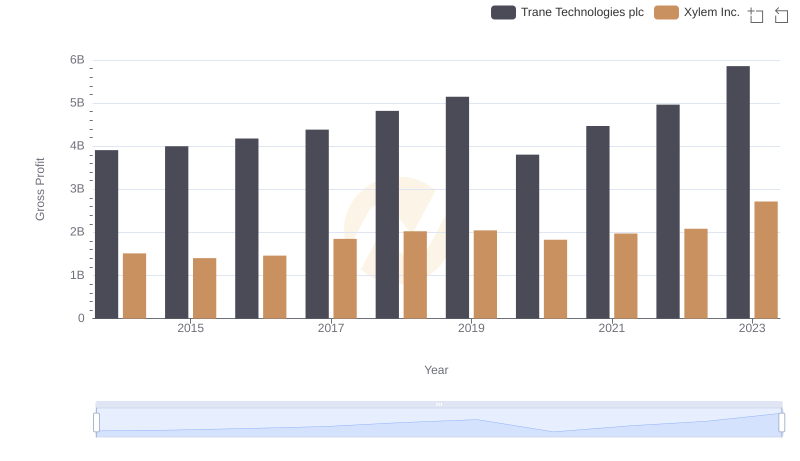
In the ever-evolving landscape of global business, the performance of industry leaders like Trane Technologies plc and Ferrovial SE offers a fascinating glimpse into market dynamics. Over the past decade, from 2014 to 2023, these two companies have showcased contrasting trajectories in gross profit performance.
Ferrovial SE, a titan in infrastructure and services, experienced a significant fluctuation in its gross profit. Starting strong in 2014, it peaked in 2017 with a 41% increase from its 2014 figures. However, a sharp decline in 2018 saw profits drop by over 56%, only to recover steadily by 2023.
Conversely, Trane Technologies plc, a leader in climate solutions, demonstrated a more consistent growth pattern. From 2014 to 2023, its gross profit rose by approximately 50%, reflecting a robust and steady expansion strategy.
This comparative analysis underscores the diverse strategies and market conditions influencing these global powerhouses.
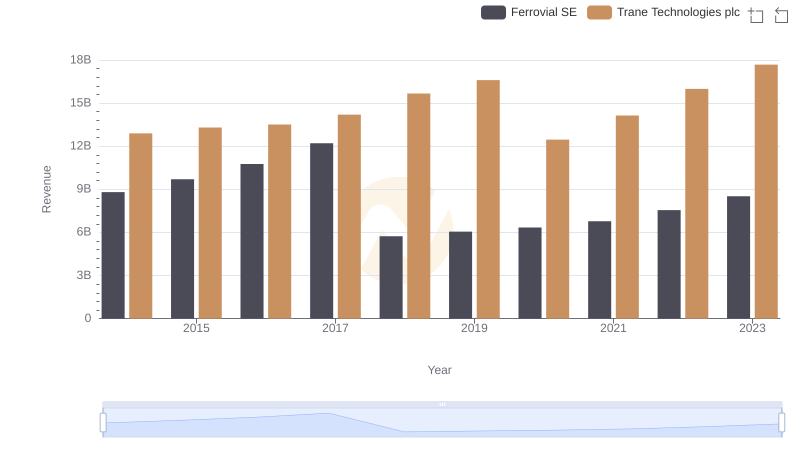
Comparing Revenue Performance: Trane Technologies plc or Ferrovial SE?
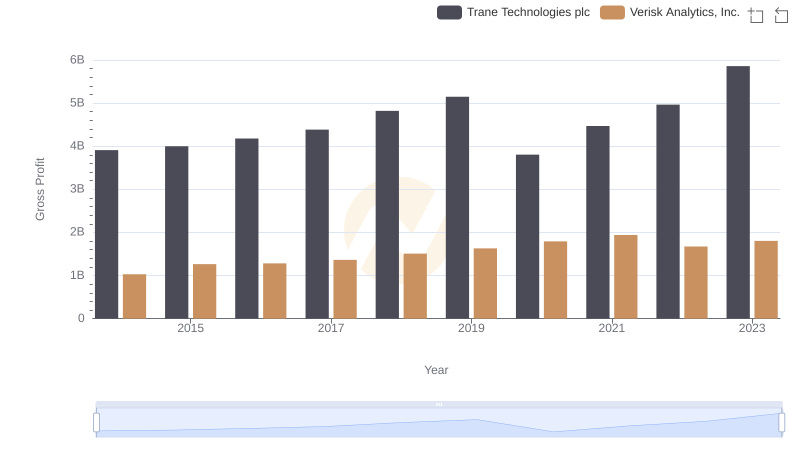
Gross Profit Trends Compared: Trane Technologies plc vs Verisk Analytics, Inc.
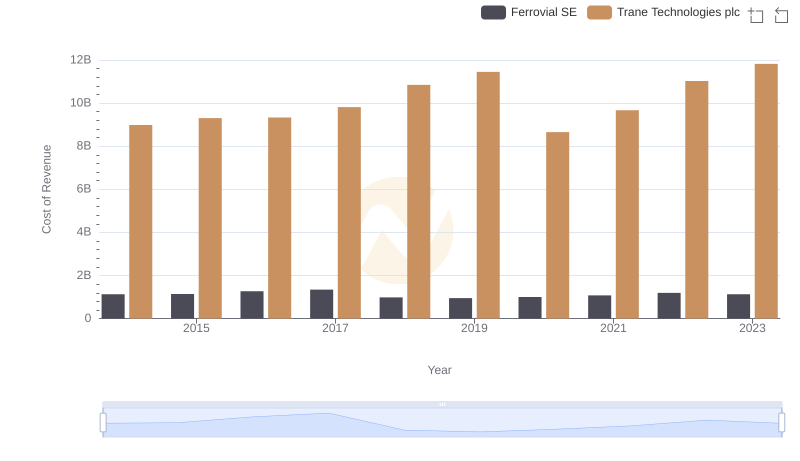
Cost of Revenue Comparison: Trane Technologies plc vs Ferrovial SE
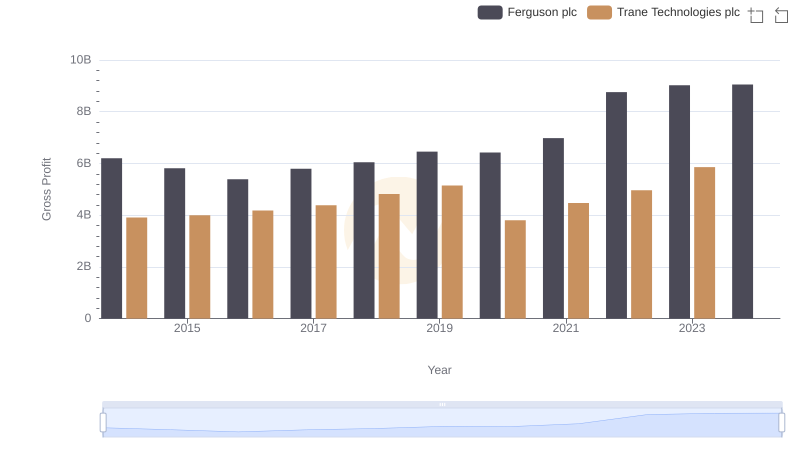
Trane Technologies plc vs Ferguson plc: A Gross Profit Performance Breakdown
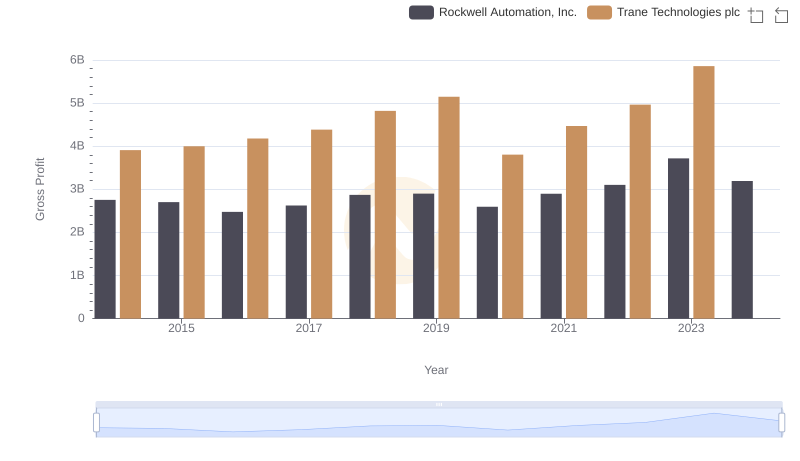
Who Generates Higher Gross Profit? Trane Technologies plc or Rockwell Automation, Inc.
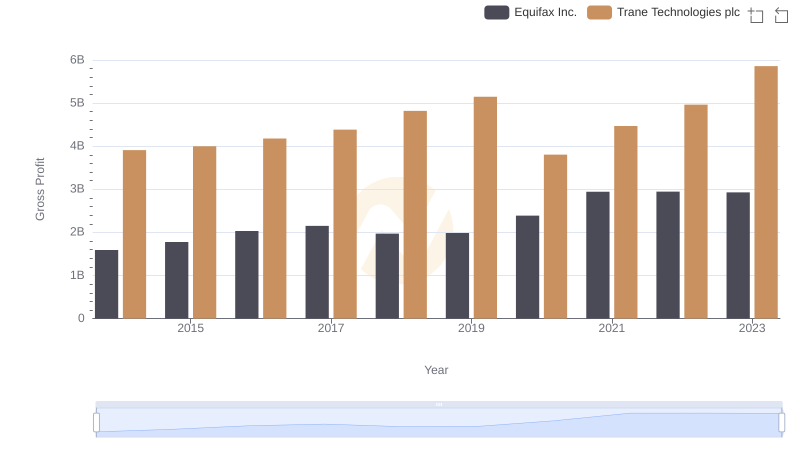
Trane Technologies plc and Equifax Inc.: A Detailed Gross Profit Analysis
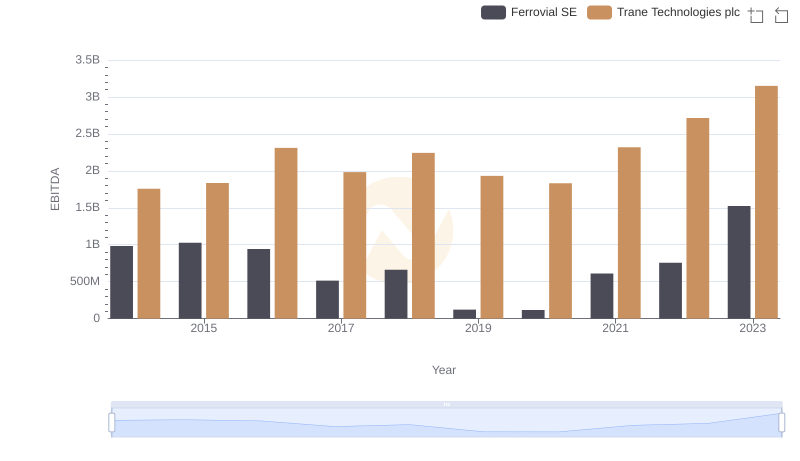
Professional EBITDA Benchmarking: Trane Technologies plc vs Ferrovial SE
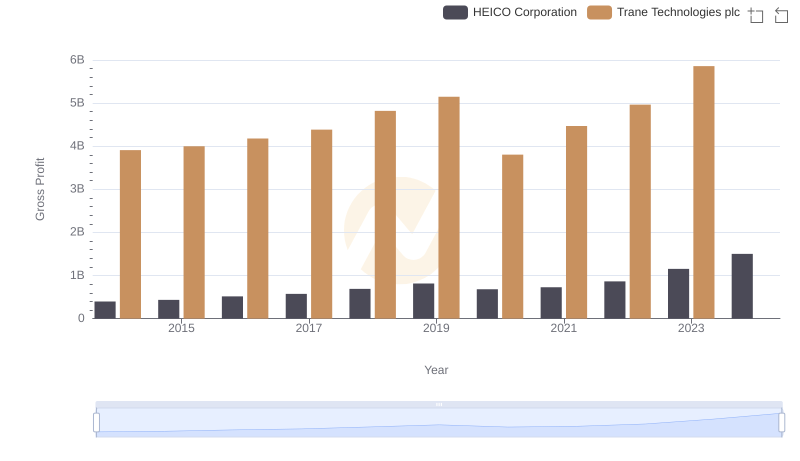
Who Generates Higher Gross Profit? Trane Technologies plc or HEICO Corporation
Trane Technologies plc vs Xylem Inc.: A Gross Profit Performance Breakdown