| __timestamp | Ferrovial SE | Trane Technologies plc |
|---|---|---|
| Wednesday, January 1, 2014 | 983000000 | 1757000000 |
| Thursday, January 1, 2015 | 1027000000 | 1835000000 |
| Friday, January 1, 2016 | 943000000 | 2311000000 |
| Sunday, January 1, 2017 | 515000000 | 1982500000 |
| Monday, January 1, 2018 | 661000000 | 2242400000 |
| Tuesday, January 1, 2019 | 121000000 | 1931200000 |
| Wednesday, January 1, 2020 | 116000000 | 1831900000 |
| Friday, January 1, 2021 | 610000000 | 2319200000 |
| Saturday, January 1, 2022 | 756000000 | 2715500000 |
| Sunday, January 1, 2023 | 1524000000 | 3149900000 |
| Monday, January 1, 2024 | 3859600000 |
In pursuit of knowledge
In the ever-evolving landscape of global business, understanding the financial health of industry giants is crucial. This analysis delves into the EBITDA performance of Trane Technologies plc and Ferrovial SE from 2014 to 2023. Over this period, Trane Technologies consistently outperformed Ferrovial SE, with an average EBITDA nearly three times higher. Notably, Trane Technologies saw a remarkable 79% increase in EBITDA from 2014 to 2023, peaking at approximately 3.15 billion in 2023. In contrast, Ferrovial SE experienced a more volatile journey, with a significant surge of 92% in 2023, reaching its highest EBITDA of 1.52 billion. This data highlights the resilience and growth strategies of these companies, offering valuable insights for investors and industry analysts alike. As the global market continues to shift, keeping an eye on such financial metrics is essential for informed decision-making.
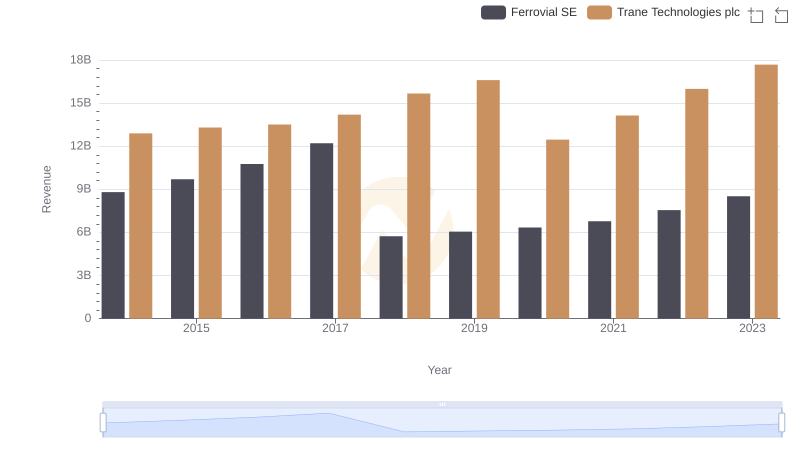
Comparing Revenue Performance: Trane Technologies plc or Ferrovial SE?
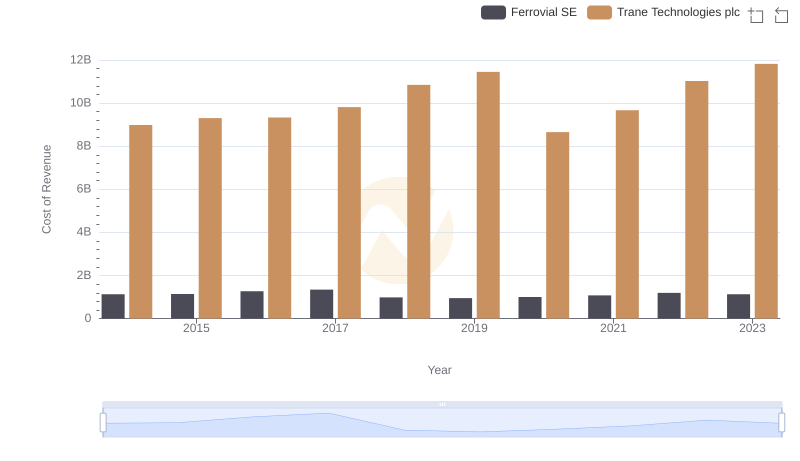
Cost of Revenue Comparison: Trane Technologies plc vs Ferrovial SE
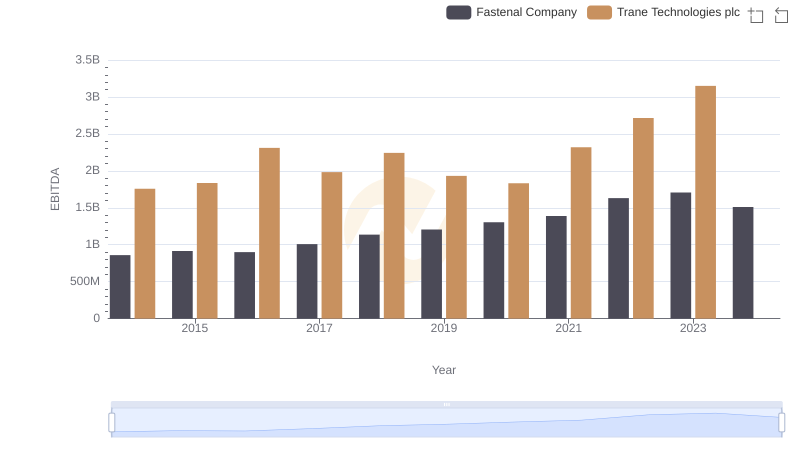
Trane Technologies plc and Fastenal Company: A Detailed Examination of EBITDA Performance
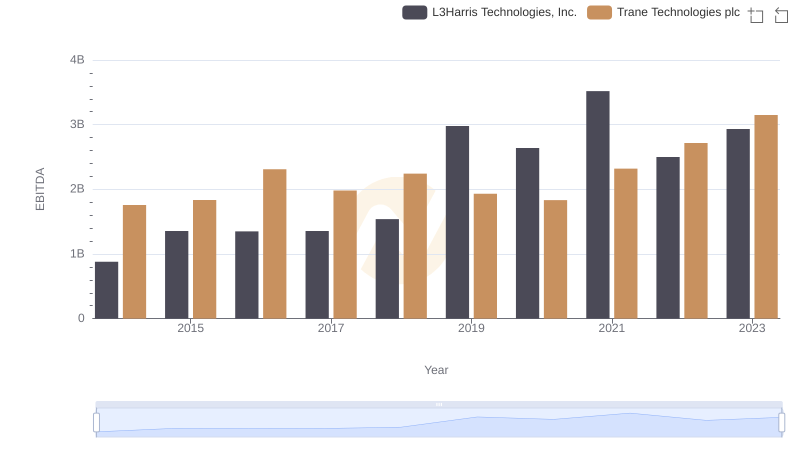
Comparative EBITDA Analysis: Trane Technologies plc vs L3Harris Technologies, Inc.
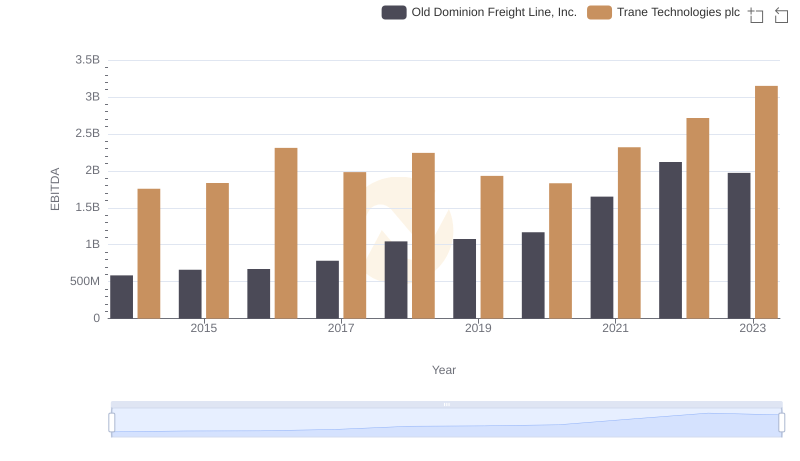
EBITDA Metrics Evaluated: Trane Technologies plc vs Old Dominion Freight Line, Inc.
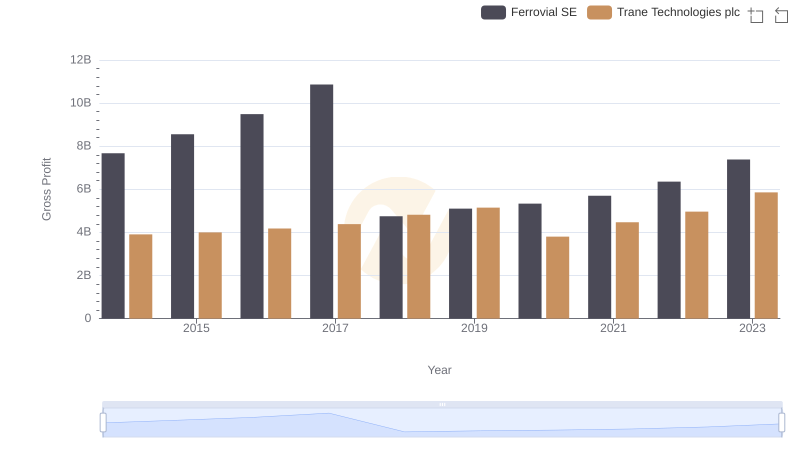
Trane Technologies plc vs Ferrovial SE: A Gross Profit Performance Breakdown
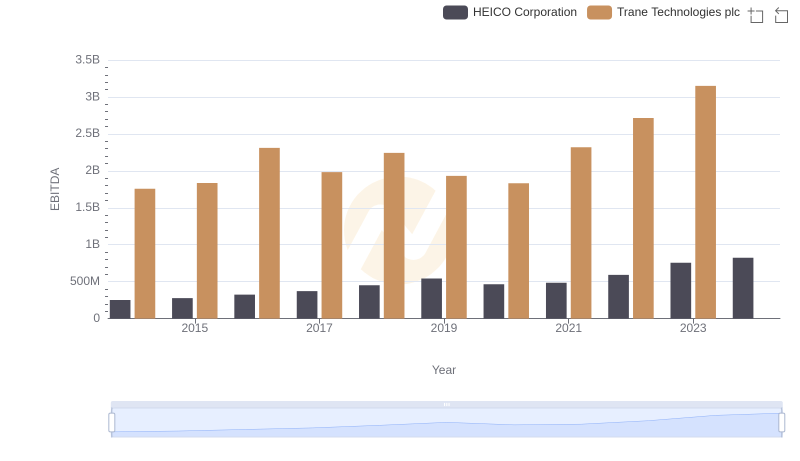
A Professional Review of EBITDA: Trane Technologies plc Compared to HEICO Corporation