| __timestamp | Trane Technologies plc | Verisk Analytics, Inc. |
|---|---|---|
| Wednesday, January 1, 2014 | 8982800000 | 716598000 |
| Thursday, January 1, 2015 | 9301600000 | 803274000 |
| Friday, January 1, 2016 | 9329300000 | 714400000 |
| Sunday, January 1, 2017 | 9811600000 | 783800000 |
| Monday, January 1, 2018 | 10847600000 | 886200000 |
| Tuesday, January 1, 2019 | 11451500000 | 976800000 |
| Wednesday, January 1, 2020 | 8651300000 | 993900000 |
| Friday, January 1, 2021 | 9666800000 | 1057800000 |
| Saturday, January 1, 2022 | 11026900000 | 824600000 |
| Sunday, January 1, 2023 | 11820400000 | 876500000 |
| Monday, January 1, 2024 | 12757700000 |
Unleashing insights
In the ever-evolving landscape of industrial and analytics sectors, understanding cost dynamics is crucial. Over the past decade, Trane Technologies plc and Verisk Analytics, Inc. have showcased distinct trends in their cost of revenue. Trane Technologies, a leader in climate solutions, has seen a steady increase in its cost of revenue, peaking at approximately $11.8 billion in 2023, marking a 31% rise since 2014. This growth reflects its expanding operations and market reach. In contrast, Verisk Analytics, a prominent data analytics firm, has maintained a more stable cost structure, with its cost of revenue hovering around $876 million in 2023, a modest 22% increase from 2014. This stability underscores Verisk's efficient cost management in a competitive industry. These trends highlight the strategic differences between a manufacturing giant and a data-driven enterprise, offering valuable insights for investors and industry analysts alike.
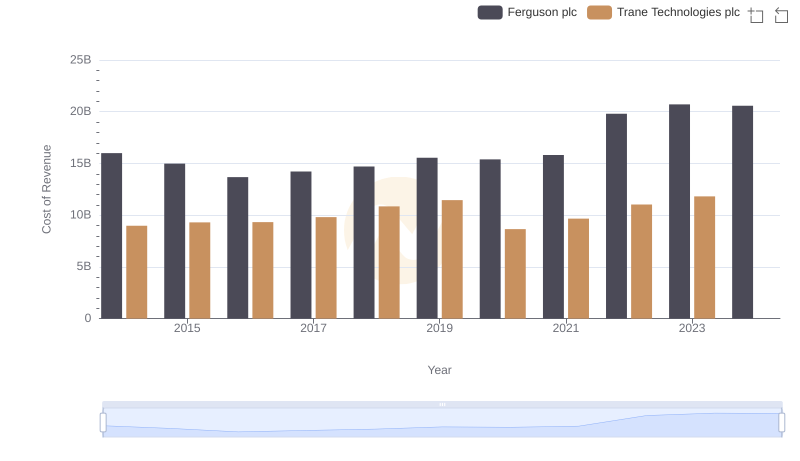
Analyzing Cost of Revenue: Trane Technologies plc and Ferguson plc

Cost of Revenue Comparison: Trane Technologies plc vs Westinghouse Air Brake Technologies Corporation
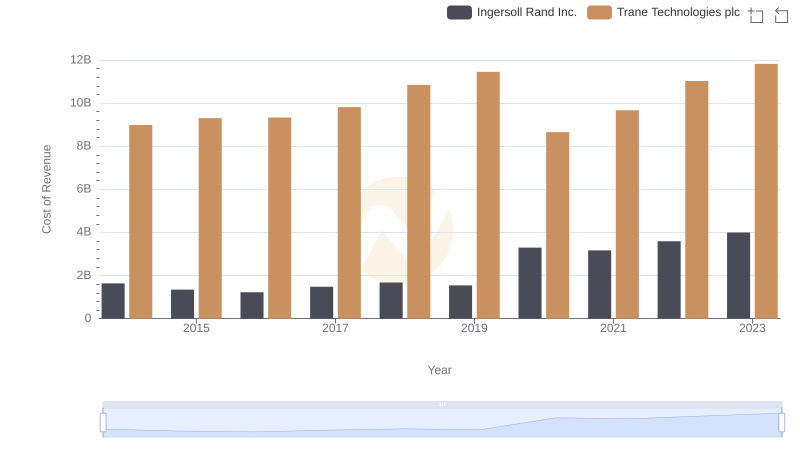
Cost of Revenue Comparison: Trane Technologies plc vs Ingersoll Rand Inc.

Comparing Cost of Revenue Efficiency: Trane Technologies plc vs United Airlines Holdings, Inc.
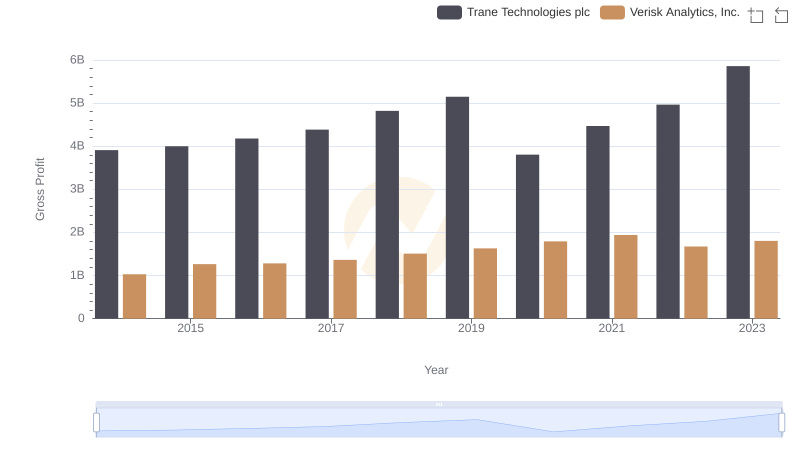
Gross Profit Trends Compared: Trane Technologies plc vs Verisk Analytics, Inc.
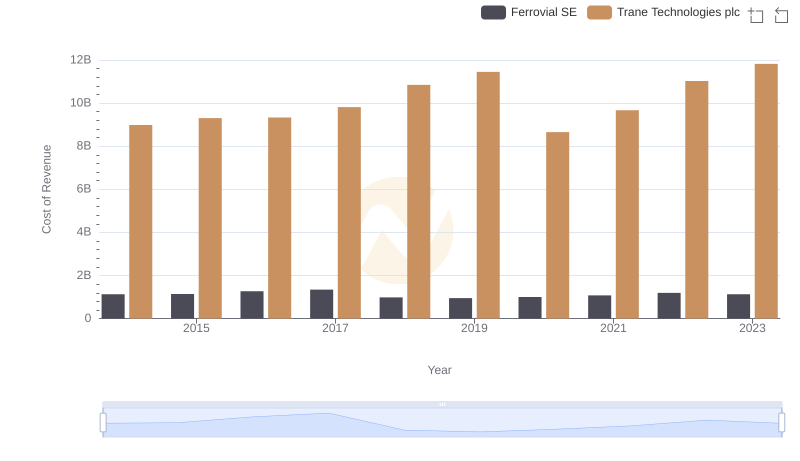
Cost of Revenue Comparison: Trane Technologies plc vs Ferrovial SE
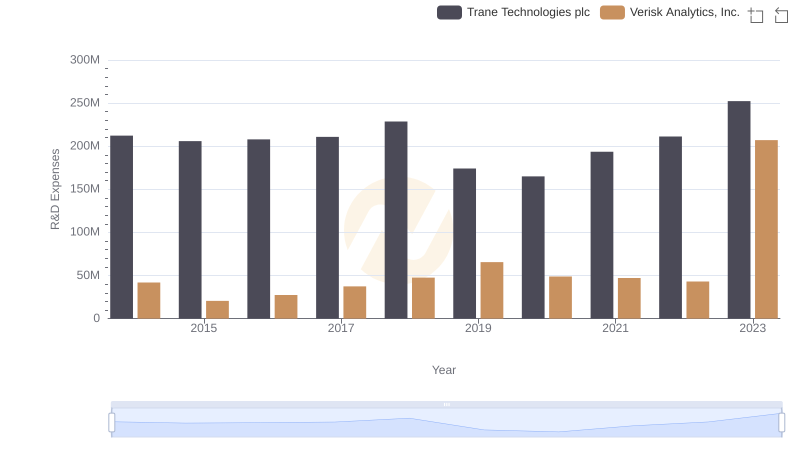
Trane Technologies plc vs Verisk Analytics, Inc.: Strategic Focus on R&D Spending
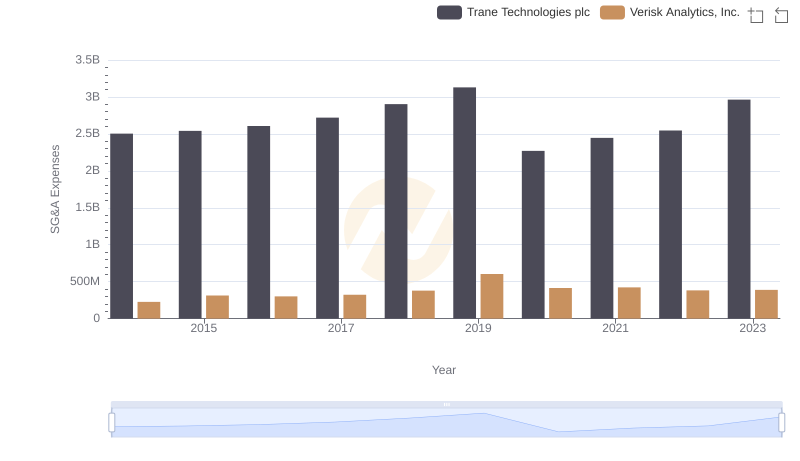
Cost Management Insights: SG&A Expenses for Trane Technologies plc and Verisk Analytics, Inc.