| __timestamp | Trane Technologies plc | United Airlines Holdings, Inc. |
|---|---|---|
| Wednesday, January 1, 2014 | 8982800000 | 29569000000 |
| Thursday, January 1, 2015 | 9301600000 | 25952000000 |
| Friday, January 1, 2016 | 9329300000 | 24856000000 |
| Sunday, January 1, 2017 | 9811600000 | 27056000000 |
| Monday, January 1, 2018 | 10847600000 | 30165000000 |
| Tuesday, January 1, 2019 | 11451500000 | 30786000000 |
| Wednesday, January 1, 2020 | 8651300000 | 20385000000 |
| Friday, January 1, 2021 | 9666800000 | 23913000000 |
| Saturday, January 1, 2022 | 11026900000 | 34315000000 |
| Sunday, January 1, 2023 | 11820400000 | 38518000000 |
| Monday, January 1, 2024 | 12757700000 | 37643000000 |
In pursuit of knowledge
In the ever-evolving landscape of corporate efficiency, Trane Technologies plc and United Airlines Holdings, Inc. present a fascinating study. Over the past decade, from 2014 to 2023, these two industry leaders have showcased distinct trajectories in managing their cost of revenue.
Trane Technologies has demonstrated a consistent upward trend, with its cost of revenue increasing by approximately 32% over the period. This steady growth reflects the company's strategic investments and operational efficiencies, culminating in a peak in 2023.
Conversely, United Airlines has experienced more volatility. Despite a dip in 2020, likely due to the pandemic's impact, the airline rebounded strongly, achieving a 30% increase in cost of revenue by 2023. This resilience underscores United's adaptability in a challenging industry.
Both companies exemplify unique approaches to cost management, offering valuable insights into their respective sectors.
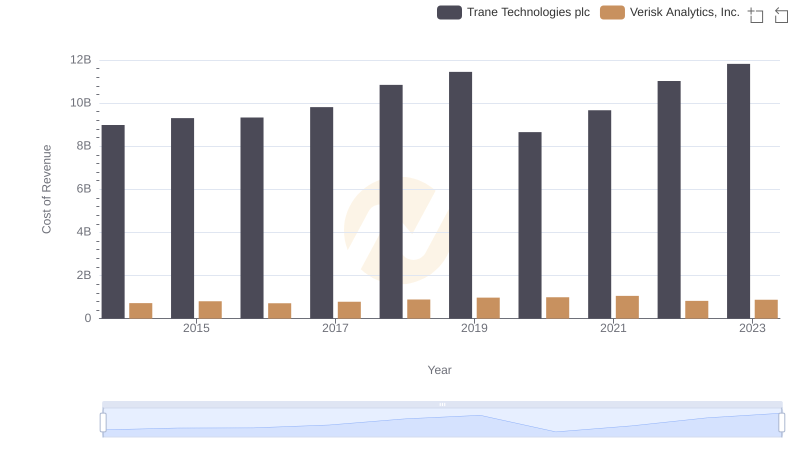
Cost of Revenue Trends: Trane Technologies plc vs Verisk Analytics, Inc.
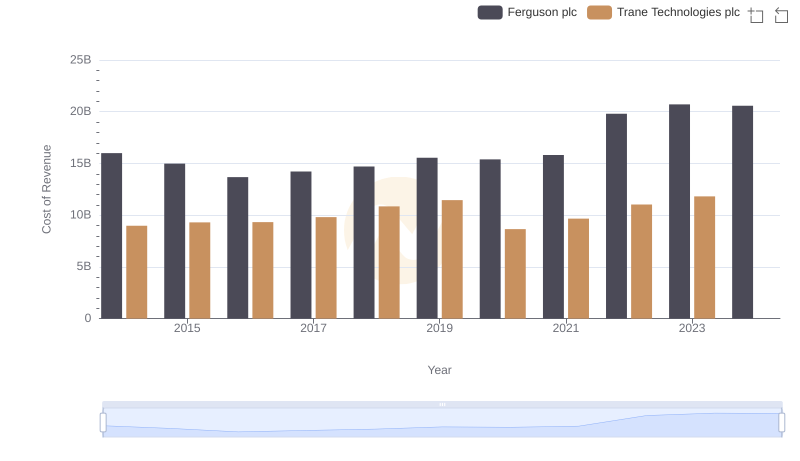
Analyzing Cost of Revenue: Trane Technologies plc and Ferguson plc

Cost of Revenue Comparison: Trane Technologies plc vs Westinghouse Air Brake Technologies Corporation
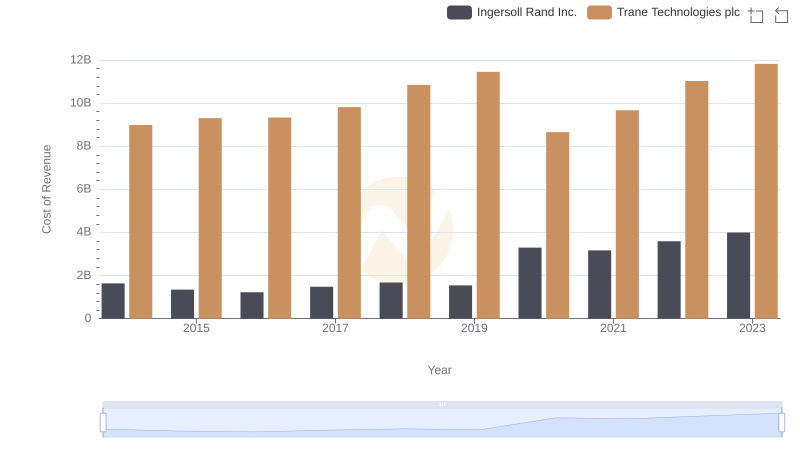
Cost of Revenue Comparison: Trane Technologies plc vs Ingersoll Rand Inc.
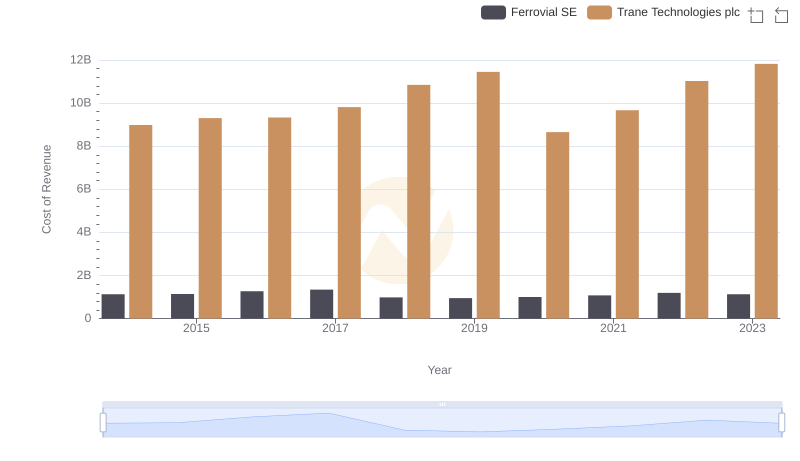
Cost of Revenue Comparison: Trane Technologies plc vs Ferrovial SE
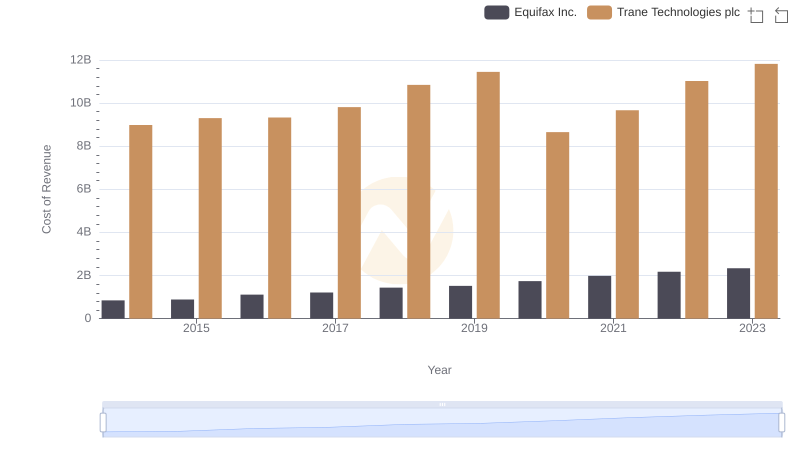
Cost of Revenue Comparison: Trane Technologies plc vs Equifax Inc.
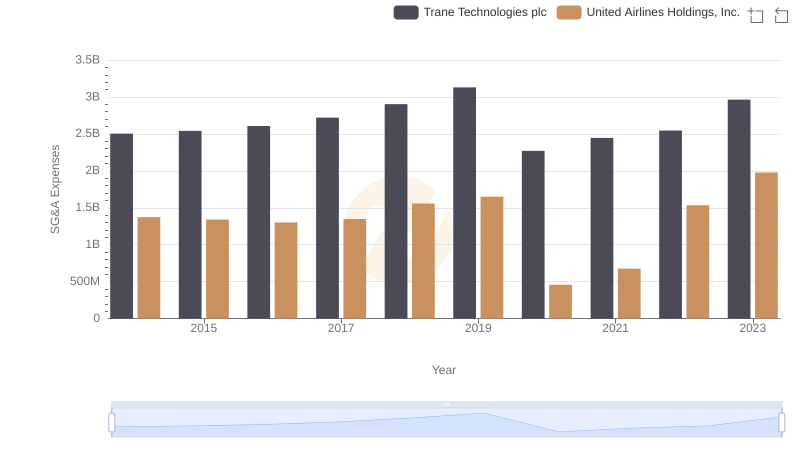
Trane Technologies plc vs United Airlines Holdings, Inc.: SG&A Expense Trends
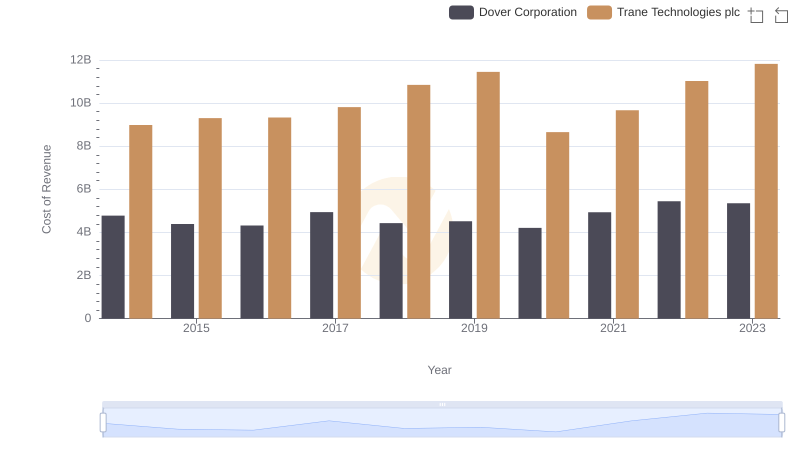
Cost of Revenue: Key Insights for Trane Technologies plc and Dover Corporation
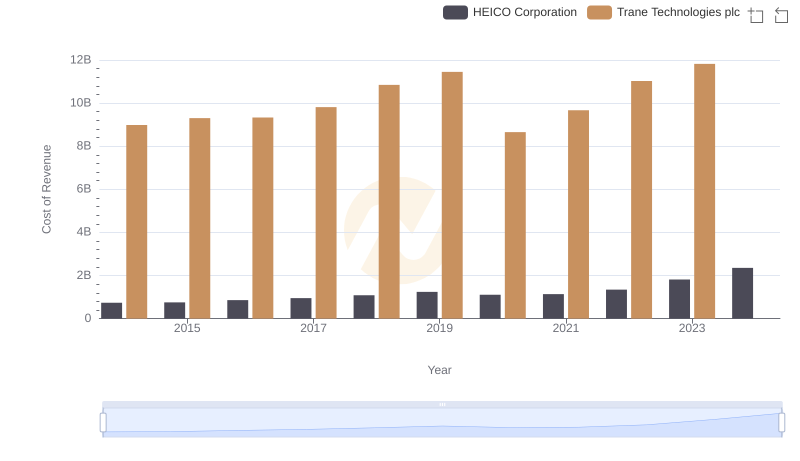
Cost Insights: Breaking Down Trane Technologies plc and HEICO Corporation's Expenses