| __timestamp | Ingersoll Rand Inc. | Trane Technologies plc |
|---|---|---|
| Wednesday, January 1, 2014 | 1633224000 | 8982800000 |
| Thursday, January 1, 2015 | 1347800000 | 9301600000 |
| Friday, January 1, 2016 | 1222705000 | 9329300000 |
| Sunday, January 1, 2017 | 1477500000 | 9811600000 |
| Monday, January 1, 2018 | 1677300000 | 10847600000 |
| Tuesday, January 1, 2019 | 1540200000 | 11451500000 |
| Wednesday, January 1, 2020 | 3296800000 | 8651300000 |
| Friday, January 1, 2021 | 3163900000 | 9666800000 |
| Saturday, January 1, 2022 | 3590700000 | 11026900000 |
| Sunday, January 1, 2023 | 3993900000 | 11820400000 |
| Monday, January 1, 2024 | 0 | 12757700000 |
Unleashing insights
In the competitive landscape of industrial manufacturing, Trane Technologies plc and Ingersoll Rand Inc. have been pivotal players. Over the past decade, these companies have showcased contrasting trajectories in their cost of revenue. Trane Technologies has consistently maintained a higher cost of revenue, peaking at approximately $11.8 billion in 2023, reflecting its expansive operations and market reach. In contrast, Ingersoll Rand's cost of revenue, while growing, reached around $4 billion in the same year, marking a significant increase from its 2014 figure of $1.6 billion.
From 2014 to 2023, Trane Technologies' cost of revenue grew by about 32%, while Ingersoll Rand saw a remarkable 145% increase. This stark difference highlights Ingersoll Rand's aggressive expansion and strategic investments. As these industrial titans continue to evolve, their financial strategies offer valuable insights into the broader market dynamics.
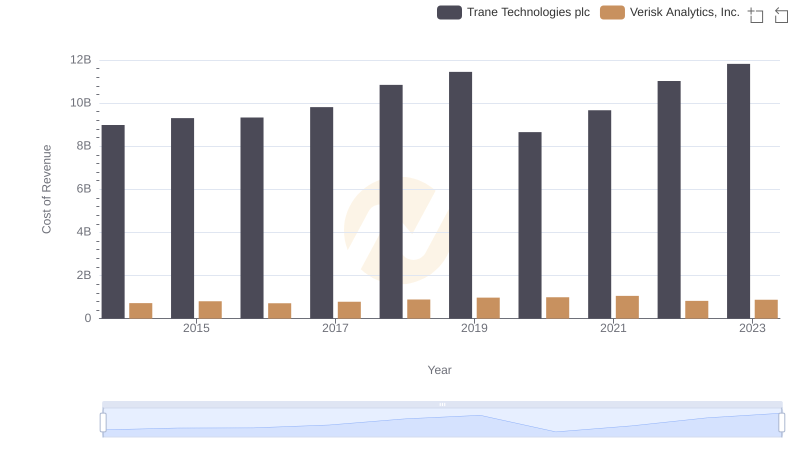
Cost of Revenue Trends: Trane Technologies plc vs Verisk Analytics, Inc.
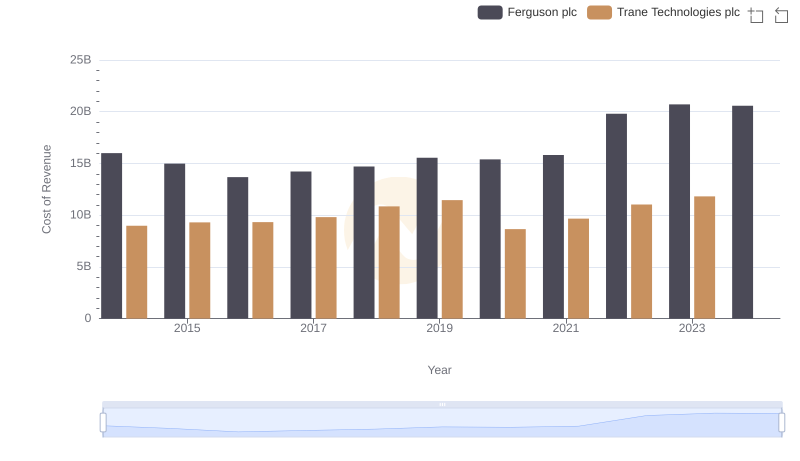
Analyzing Cost of Revenue: Trane Technologies plc and Ferguson plc

Cost of Revenue Comparison: Trane Technologies plc vs Westinghouse Air Brake Technologies Corporation

Comparing Cost of Revenue Efficiency: Trane Technologies plc vs United Airlines Holdings, Inc.
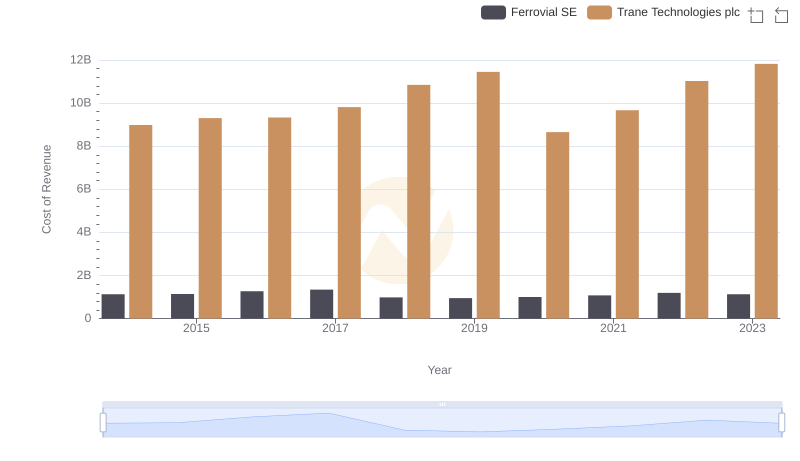
Cost of Revenue Comparison: Trane Technologies plc vs Ferrovial SE
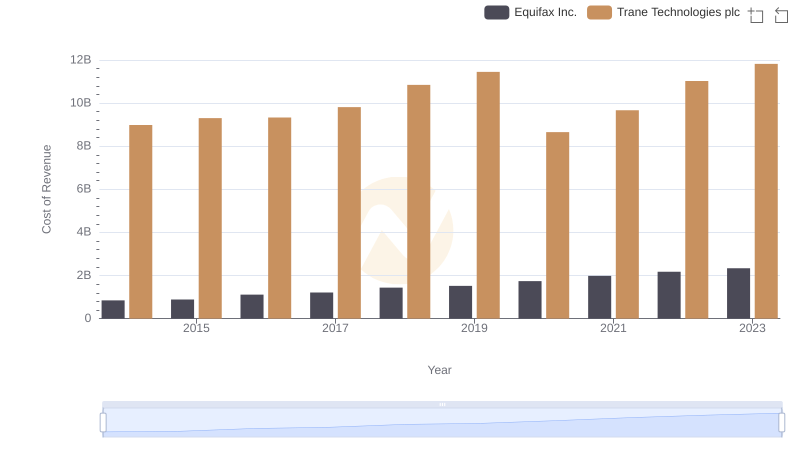
Cost of Revenue Comparison: Trane Technologies plc vs Equifax Inc.
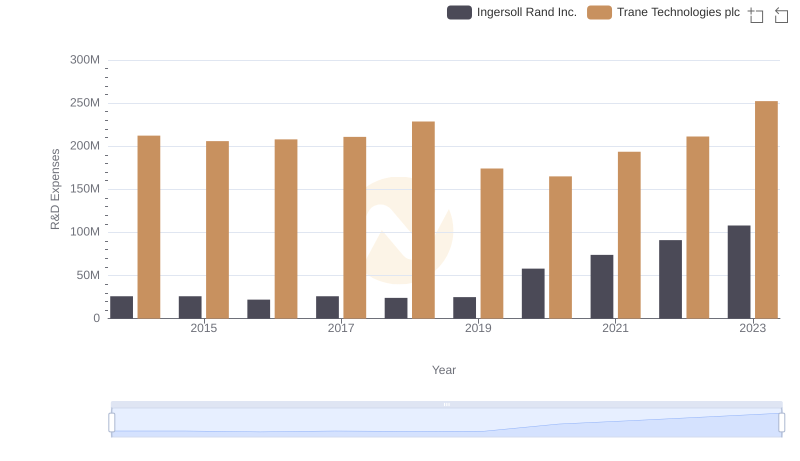
Analyzing R&D Budgets: Trane Technologies plc vs Ingersoll Rand Inc.
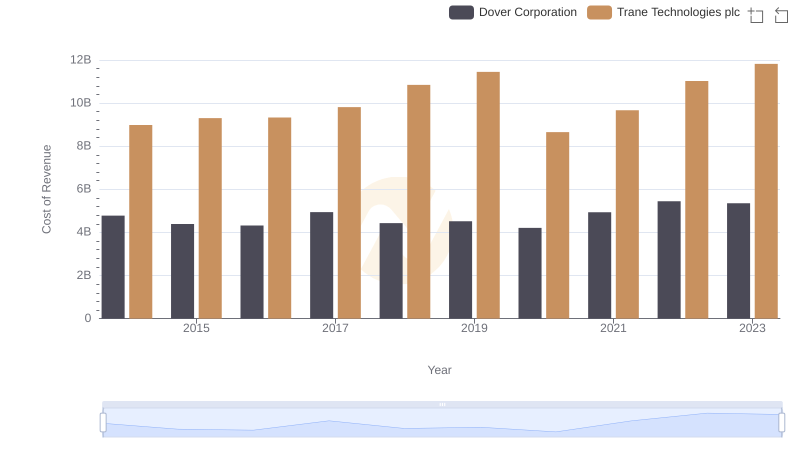
Cost of Revenue: Key Insights for Trane Technologies plc and Dover Corporation
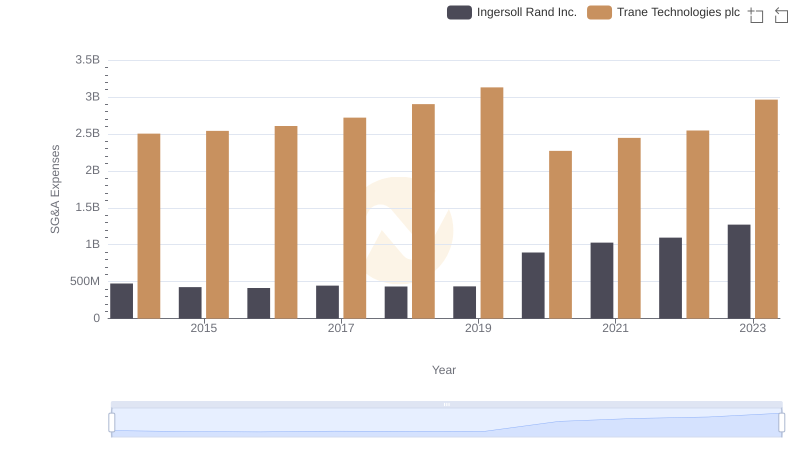
Comparing SG&A Expenses: Trane Technologies plc vs Ingersoll Rand Inc. Trends and Insights