| __timestamp | Ferguson plc | Trane Technologies plc |
|---|---|---|
| Wednesday, January 1, 2014 | 15995739428 | 8982800000 |
| Thursday, January 1, 2015 | 14984241894 | 9301600000 |
| Friday, January 1, 2016 | 13677144858 | 9329300000 |
| Sunday, January 1, 2017 | 14215866673 | 9811600000 |
| Monday, January 1, 2018 | 14708000000 | 10847600000 |
| Tuesday, January 1, 2019 | 15552000000 | 11451500000 |
| Wednesday, January 1, 2020 | 15398000000 | 8651300000 |
| Friday, January 1, 2021 | 15812000000 | 9666800000 |
| Saturday, January 1, 2022 | 19810000000 | 11026900000 |
| Sunday, January 1, 2023 | 20709000000 | 11820400000 |
| Monday, January 1, 2024 | 20582000000 | 12757700000 |
In pursuit of knowledge
In the ever-evolving landscape of industrial and building solutions, Trane Technologies plc and Ferguson plc stand as titans. From 2014 to 2023, Ferguson plc's cost of revenue surged by approximately 30%, peaking in 2023. Meanwhile, Trane Technologies plc exhibited a more modest growth of around 32% over the same period, with a notable dip in 2020. This dip could be attributed to the global economic slowdown during the pandemic. Interestingly, Ferguson plc consistently outpaced Trane Technologies in cost of revenue, highlighting its expansive operations. However, the data for 2024 remains incomplete, leaving room for speculation on future trends. As these companies continue to innovate, understanding their financial trajectories offers valuable insights into their strategic priorities and market positioning.
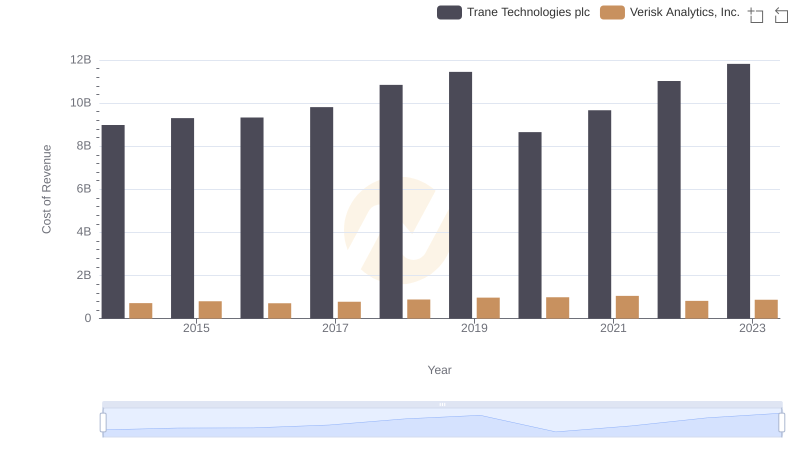
Cost of Revenue Trends: Trane Technologies plc vs Verisk Analytics, Inc.

Cost of Revenue Comparison: Trane Technologies plc vs Westinghouse Air Brake Technologies Corporation
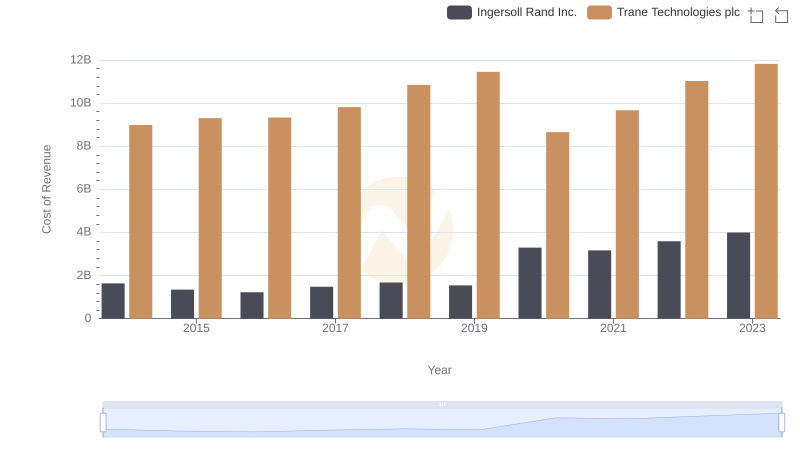
Cost of Revenue Comparison: Trane Technologies plc vs Ingersoll Rand Inc.

Comparing Cost of Revenue Efficiency: Trane Technologies plc vs United Airlines Holdings, Inc.
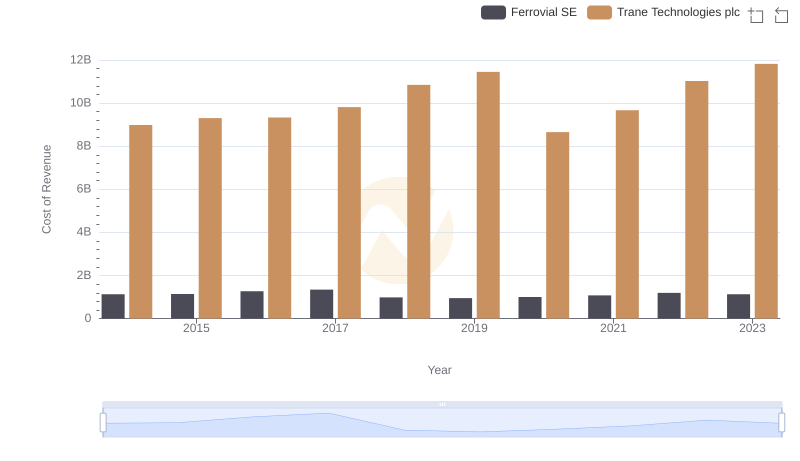
Cost of Revenue Comparison: Trane Technologies plc vs Ferrovial SE
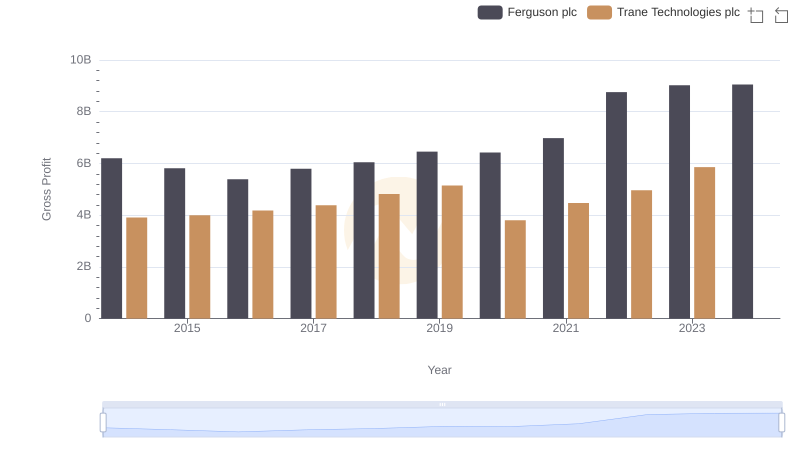
Trane Technologies plc vs Ferguson plc: A Gross Profit Performance Breakdown
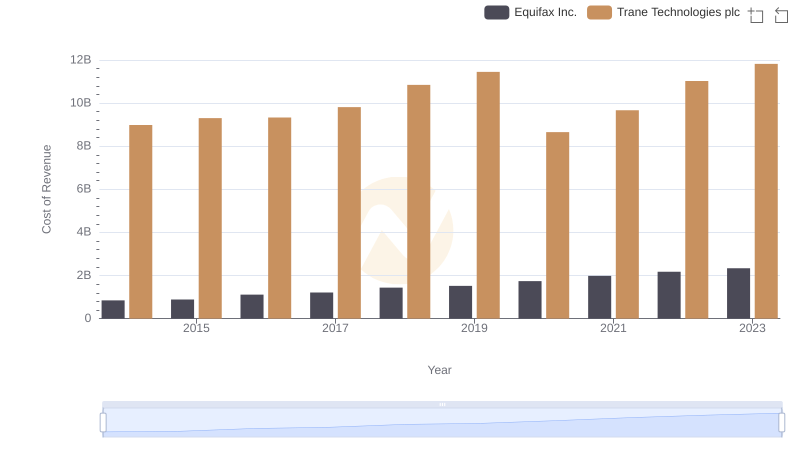
Cost of Revenue Comparison: Trane Technologies plc vs Equifax Inc.
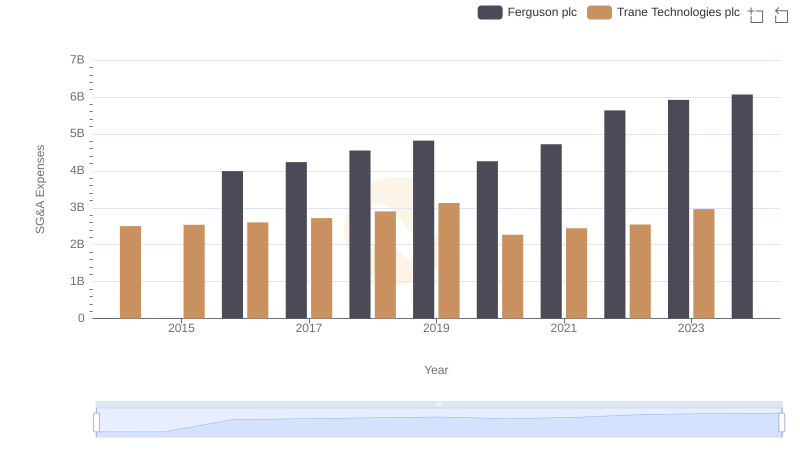
Trane Technologies plc vs Ferguson plc: SG&A Expense Trends