| __timestamp | Dover Corporation | Trane Technologies plc |
|---|---|---|
| Wednesday, January 1, 2014 | 4778479000 | 8982800000 |
| Thursday, January 1, 2015 | 4388167000 | 9301600000 |
| Friday, January 1, 2016 | 4322373000 | 9329300000 |
| Sunday, January 1, 2017 | 4940059000 | 9811600000 |
| Monday, January 1, 2018 | 4432562000 | 10847600000 |
| Tuesday, January 1, 2019 | 4515459000 | 11451500000 |
| Wednesday, January 1, 2020 | 4209741000 | 8651300000 |
| Friday, January 1, 2021 | 4937295000 | 9666800000 |
| Saturday, January 1, 2022 | 5444532000 | 11026900000 |
| Sunday, January 1, 2023 | 5353501000 | 11820400000 |
| Monday, January 1, 2024 | 4787288000 | 12757700000 |
Unveiling the hidden dimensions of data
In the ever-evolving landscape of industrial innovation, understanding cost structures is pivotal. Trane Technologies plc and Dover Corporation, two giants in the sector, have shown intriguing trends in their cost of revenue from 2014 to 2023. Trane Technologies consistently outpaces Dover, with an average cost of revenue nearly double that of Dover. Notably, Trane's cost of revenue peaked in 2023, reaching approximately 11.8 billion, marking a 37% increase from 2014. Meanwhile, Dover's cost of revenue saw a more modest rise, peaking at 5.4 billion in 2022, a 14% increase over the same period. These trends reflect strategic differences in operational scale and market focus. As we delve deeper into these figures, the data not only highlights financial strategies but also offers insights into the broader industrial landscape.
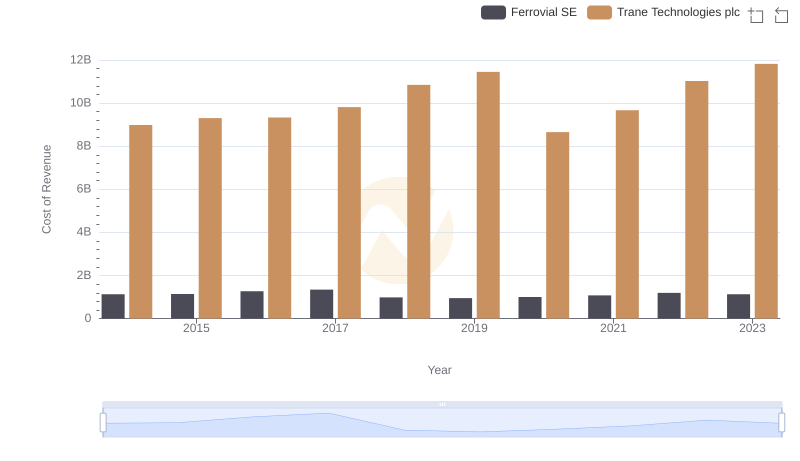
Cost of Revenue Comparison: Trane Technologies plc vs Ferrovial SE
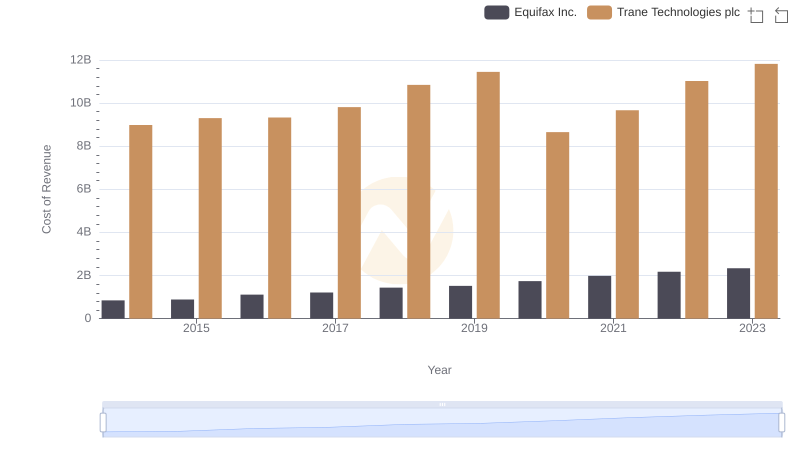
Cost of Revenue Comparison: Trane Technologies plc vs Equifax Inc.
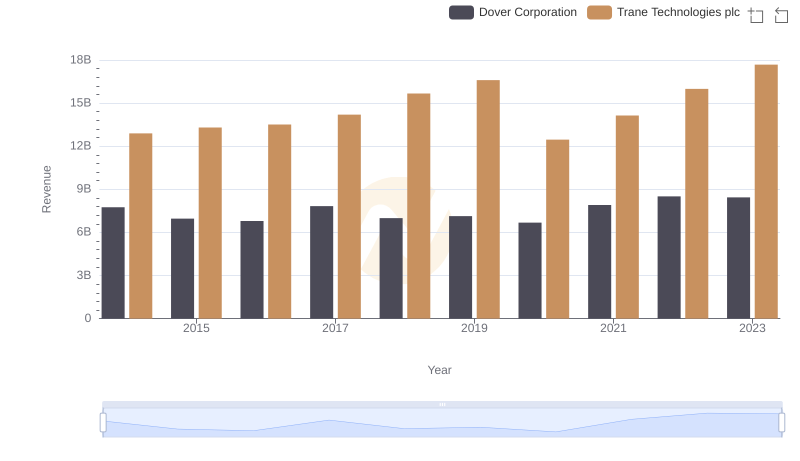
Annual Revenue Comparison: Trane Technologies plc vs Dover Corporation
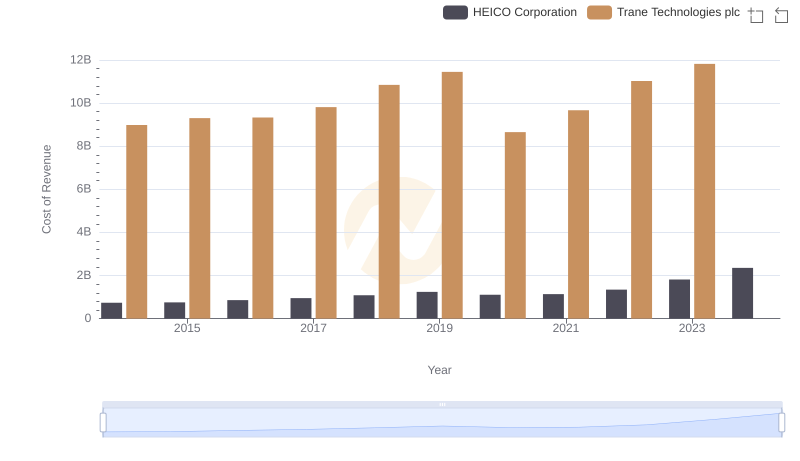
Cost Insights: Breaking Down Trane Technologies plc and HEICO Corporation's Expenses
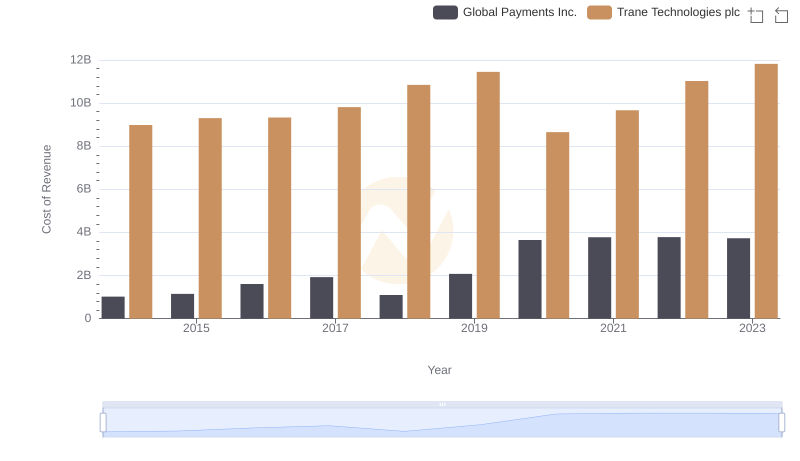
Cost of Revenue Comparison: Trane Technologies plc vs Global Payments Inc.
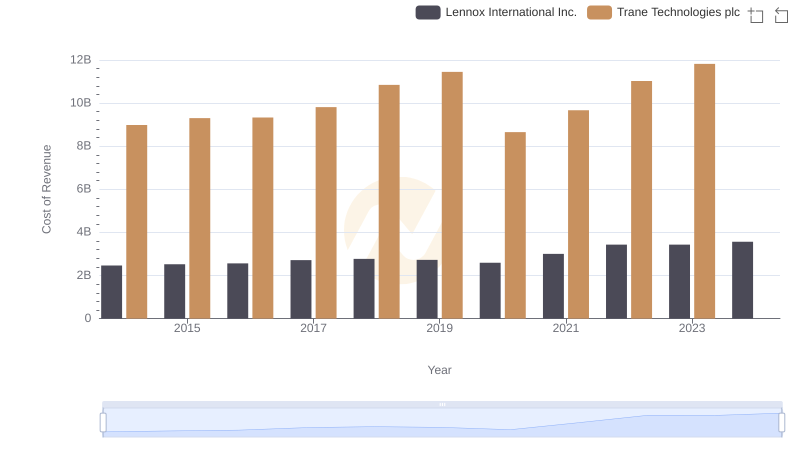
Cost Insights: Breaking Down Trane Technologies plc and Lennox International Inc.'s Expenses
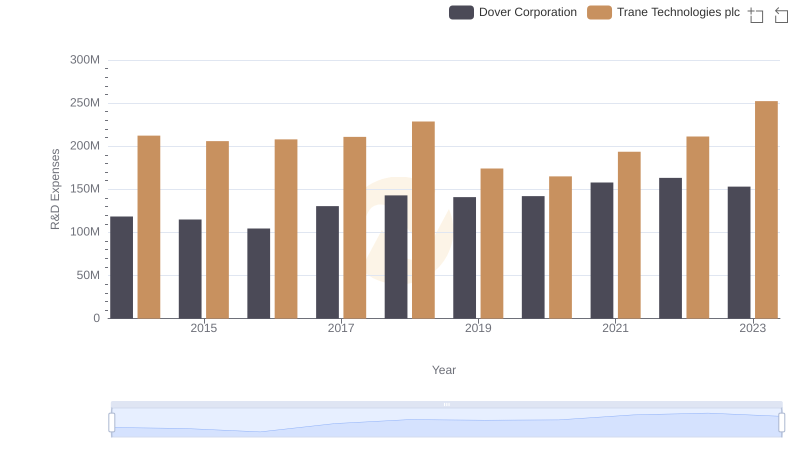
Trane Technologies plc vs Dover Corporation: Strategic Focus on R&D Spending
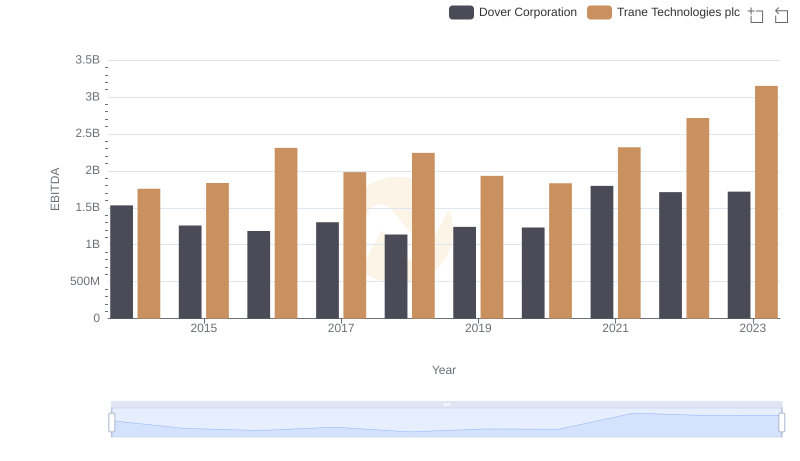
A Side-by-Side Analysis of EBITDA: Trane Technologies plc and Dover Corporation