| __timestamp | Canadian National Railway Company | Trane Technologies plc |
|---|---|---|
| Wednesday, January 1, 2014 | 7142000000 | 8982800000 |
| Thursday, January 1, 2015 | 6951000000 | 9301600000 |
| Friday, January 1, 2016 | 6362000000 | 9329300000 |
| Sunday, January 1, 2017 | 7366000000 | 9811600000 |
| Monday, January 1, 2018 | 8359000000 | 10847600000 |
| Tuesday, January 1, 2019 | 8832000000 | 11451500000 |
| Wednesday, January 1, 2020 | 8048000000 | 8651300000 |
| Friday, January 1, 2021 | 8408000000 | 9666800000 |
| Saturday, January 1, 2022 | 9711000000 | 11026900000 |
| Sunday, January 1, 2023 | 9677000000 | 11820400000 |
| Monday, January 1, 2024 | 12757700000 |
Unveiling the hidden dimensions of data
In the world of industrial and transportation sectors, Trane Technologies plc and Canadian National Railway Company stand as titans. Over the past decade, from 2014 to 2023, these companies have showcased intriguing trends in their cost of revenue. Trane Technologies, a leader in climate innovation, consistently outpaced Canadian National Railway, a major player in North American rail transport, in terms of cost of revenue.
Trane Technologies saw a steady increase, peaking in 2023 with a cost of revenue approximately 32% higher than its 2014 figure. Meanwhile, Canadian National Railway experienced a more modest growth, with a 35% increase over the same period. Notably, 2020 marked a dip for both companies, reflecting global economic challenges. This comparison not only highlights the operational scale of these companies but also offers insights into their strategic financial management over the years.
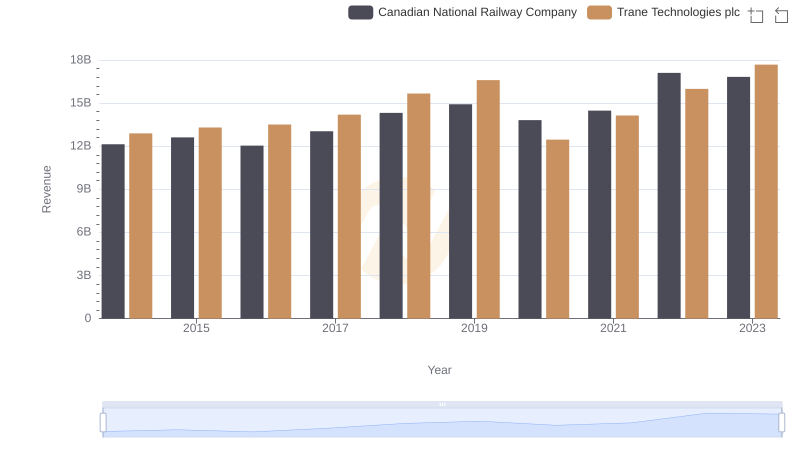
Trane Technologies plc and Canadian National Railway Company: A Comprehensive Revenue Analysis
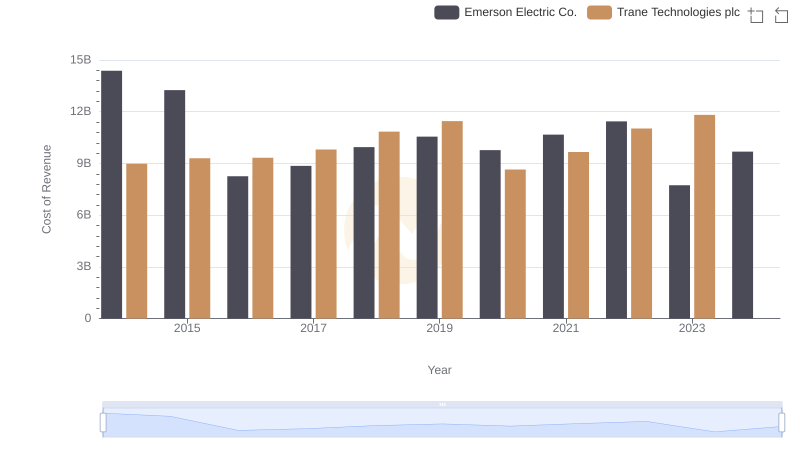
Cost of Revenue Comparison: Trane Technologies plc vs Emerson Electric Co.
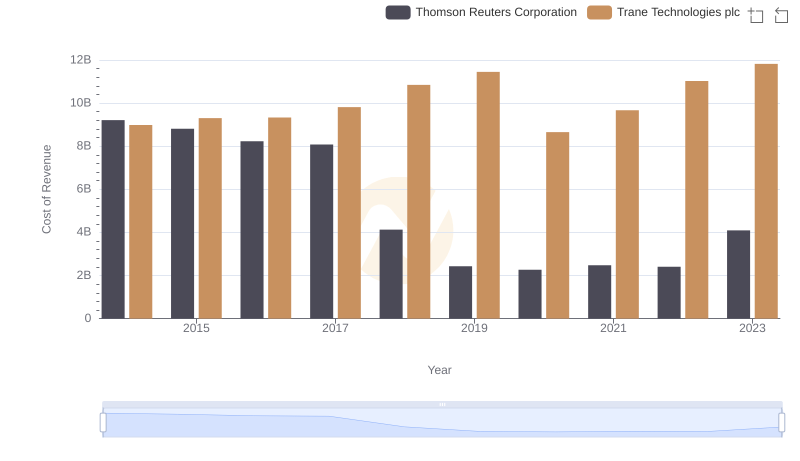
Cost of Revenue Comparison: Trane Technologies plc vs Thomson Reuters Corporation
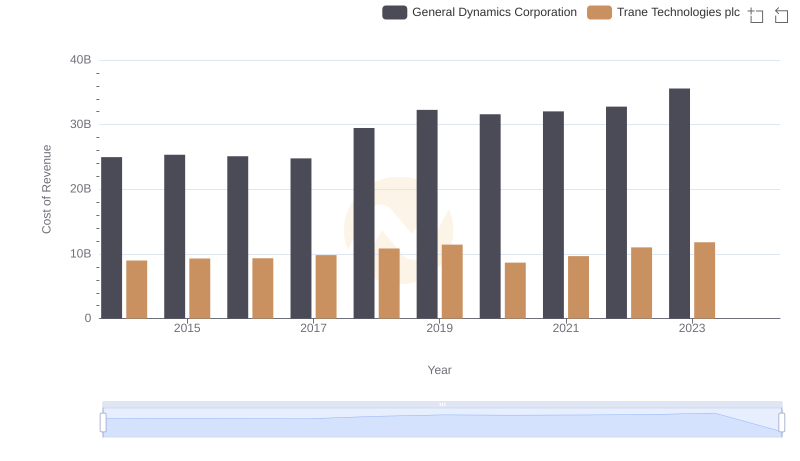
Cost of Revenue Trends: Trane Technologies plc vs General Dynamics Corporation
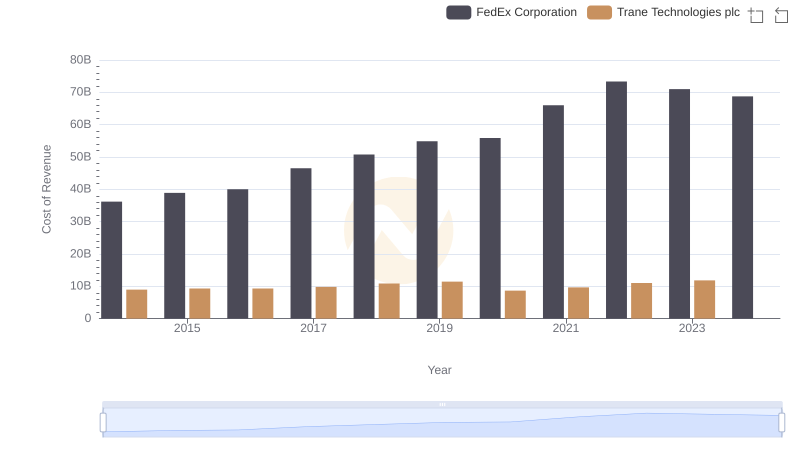
Cost of Revenue Trends: Trane Technologies plc vs FedEx Corporation
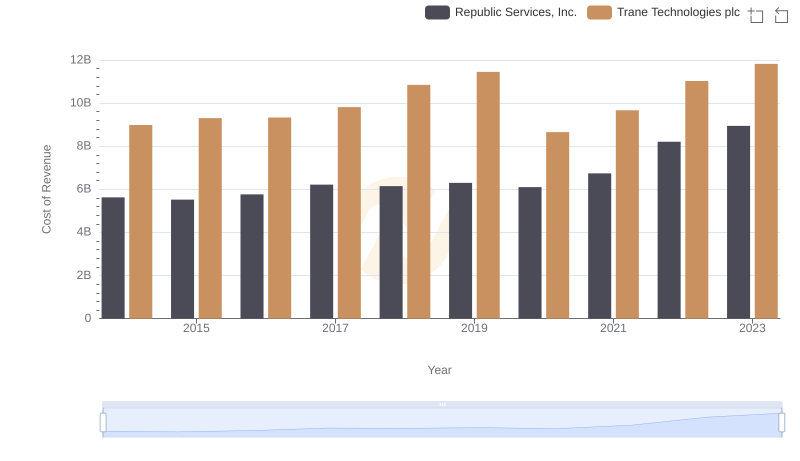
Analyzing Cost of Revenue: Trane Technologies plc and Republic Services, Inc.
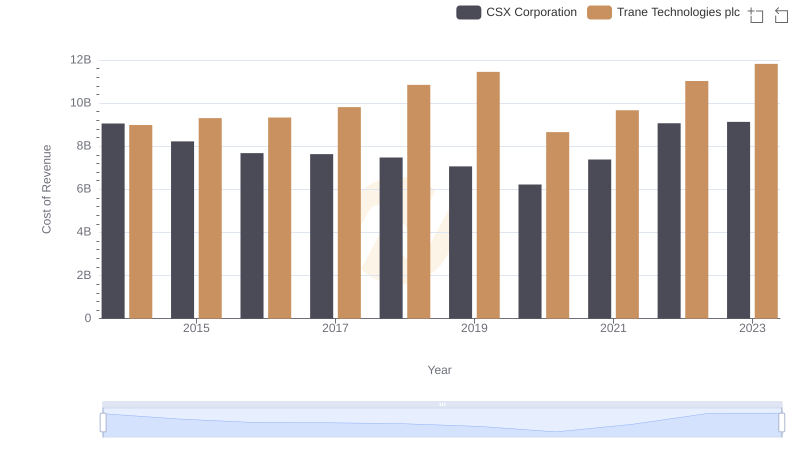
Cost of Revenue Trends: Trane Technologies plc vs CSX Corporation
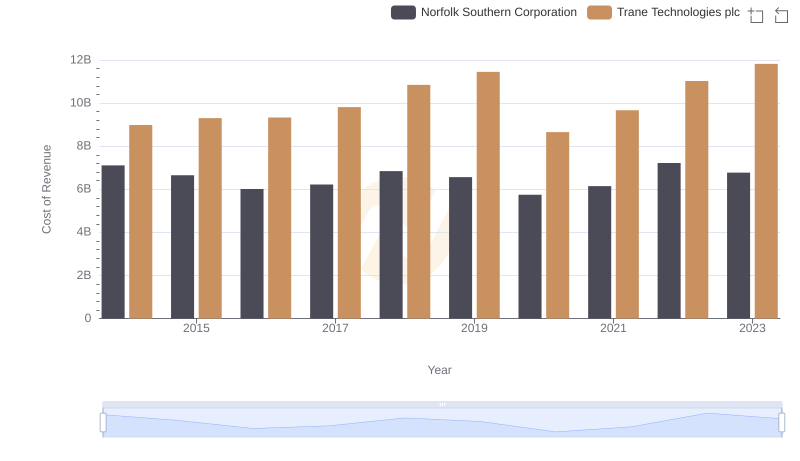
Analyzing Cost of Revenue: Trane Technologies plc and Norfolk Southern Corporation

Gross Profit Analysis: Comparing Trane Technologies plc and Canadian National Railway Company
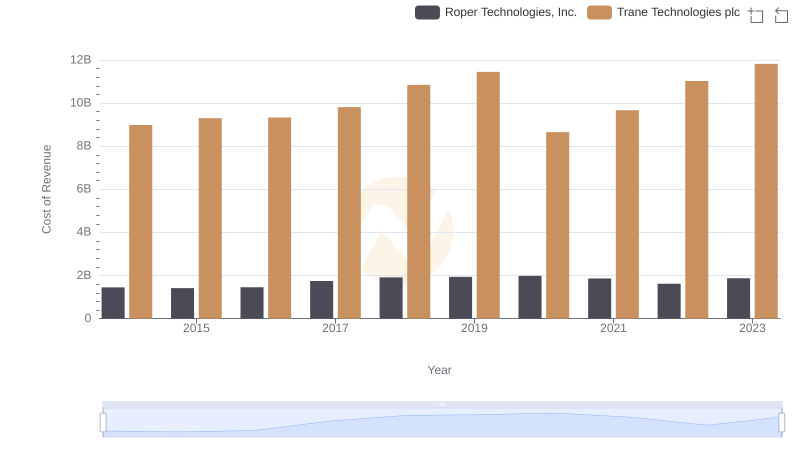
Cost of Revenue Comparison: Trane Technologies plc vs Roper Technologies, Inc.
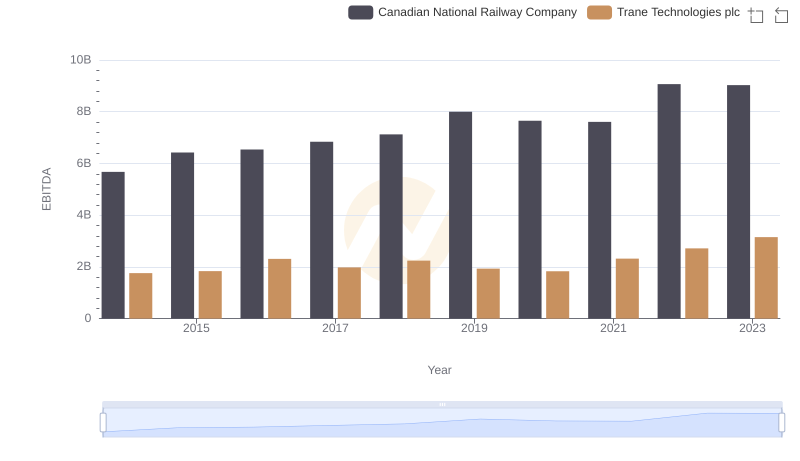
A Professional Review of EBITDA: Trane Technologies plc Compared to Canadian National Railway Company