| __timestamp | CSX Corporation | Trane Technologies plc |
|---|---|---|
| Wednesday, January 1, 2014 | 9056000000 | 8982800000 |
| Thursday, January 1, 2015 | 8227000000 | 9301600000 |
| Friday, January 1, 2016 | 7680000000 | 9329300000 |
| Sunday, January 1, 2017 | 7635000000 | 9811600000 |
| Monday, January 1, 2018 | 7477000000 | 10847600000 |
| Tuesday, January 1, 2019 | 7063000000 | 11451500000 |
| Wednesday, January 1, 2020 | 6221000000 | 8651300000 |
| Friday, January 1, 2021 | 7382000000 | 9666800000 |
| Saturday, January 1, 2022 | 9068000000 | 11026900000 |
| Sunday, January 1, 2023 | 9130000000 | 11820400000 |
| Monday, January 1, 2024 | 12757700000 |
Unleashing insights
In the ever-evolving landscape of American industry, Trane Technologies plc and CSX Corporation stand as titans in their respective fields. Over the past decade, these companies have showcased intriguing trends in their cost of revenue, a critical metric that reflects the direct costs attributable to the production of goods sold.
From 2014 to 2023, Trane Technologies plc has seen a consistent upward trajectory in its cost of revenue, peaking at approximately $11.8 billion in 2023. This represents a robust 32% increase from its 2014 figures, highlighting the company's expanding operations and market reach.
Conversely, CSX Corporation experienced a more volatile journey. After a dip in 2020, the company rebounded, reaching a high of $9.13 billion in 2023, marking a 1% increase from 2014. This fluctuation underscores the dynamic nature of the transportation sector.
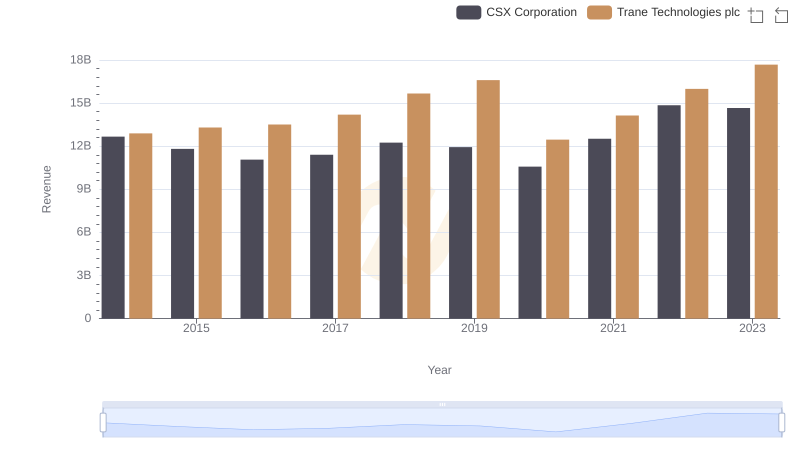
Breaking Down Revenue Trends: Trane Technologies plc vs CSX Corporation
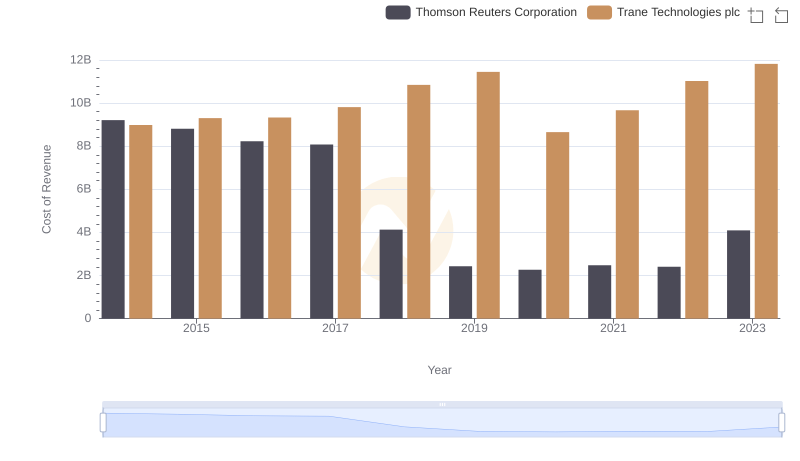
Cost of Revenue Comparison: Trane Technologies plc vs Thomson Reuters Corporation
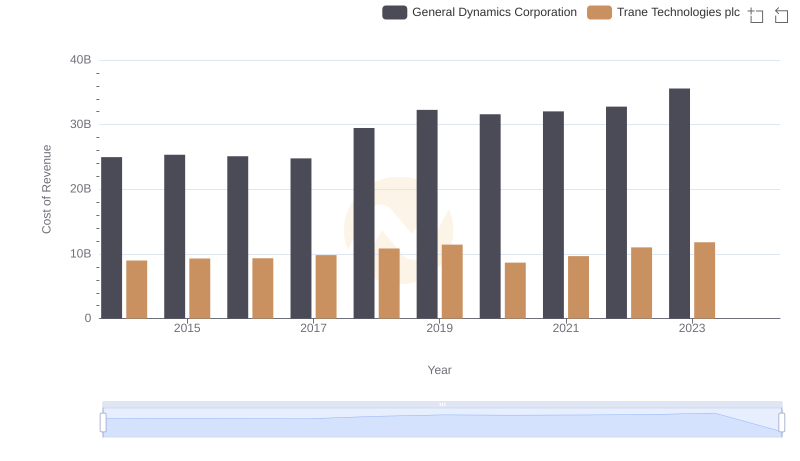
Cost of Revenue Trends: Trane Technologies plc vs General Dynamics Corporation
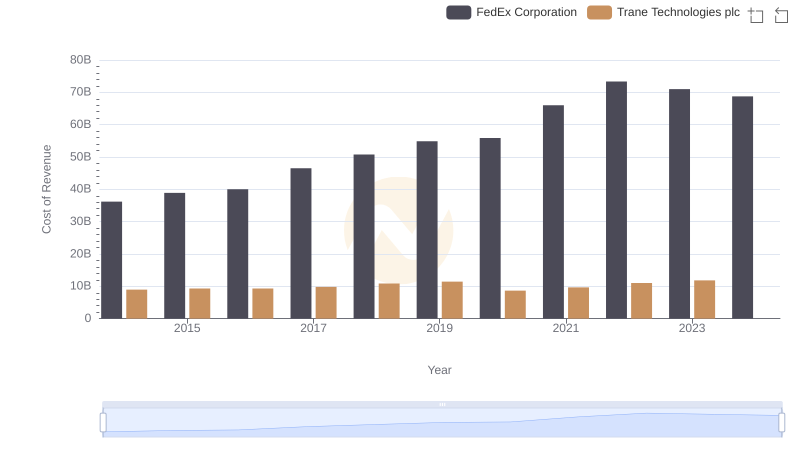
Cost of Revenue Trends: Trane Technologies plc vs FedEx Corporation
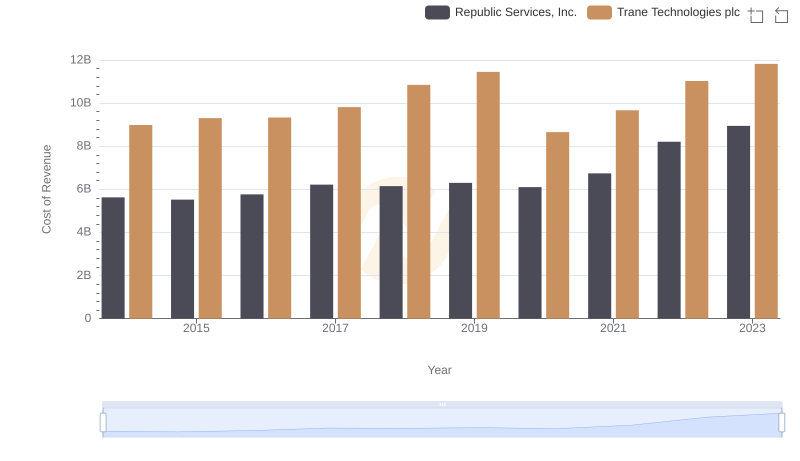
Analyzing Cost of Revenue: Trane Technologies plc and Republic Services, Inc.
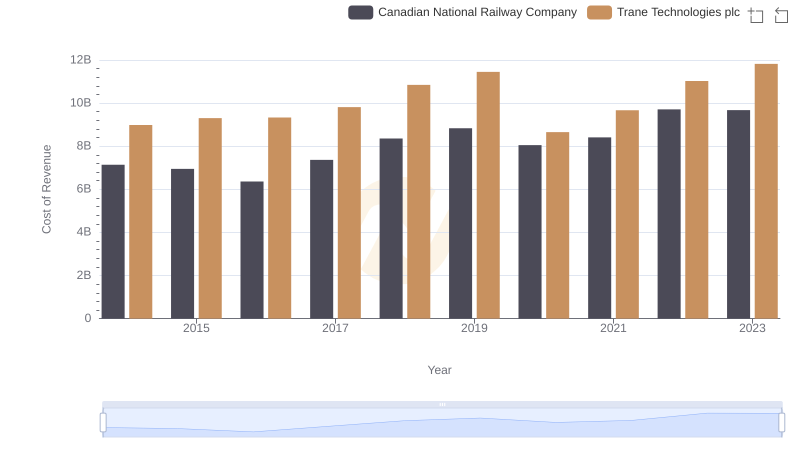
Cost of Revenue Comparison: Trane Technologies plc vs Canadian National Railway Company
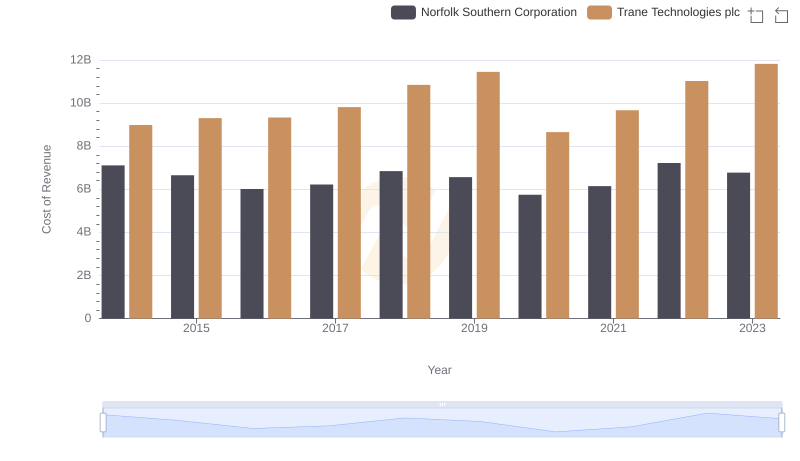
Analyzing Cost of Revenue: Trane Technologies plc and Norfolk Southern Corporation
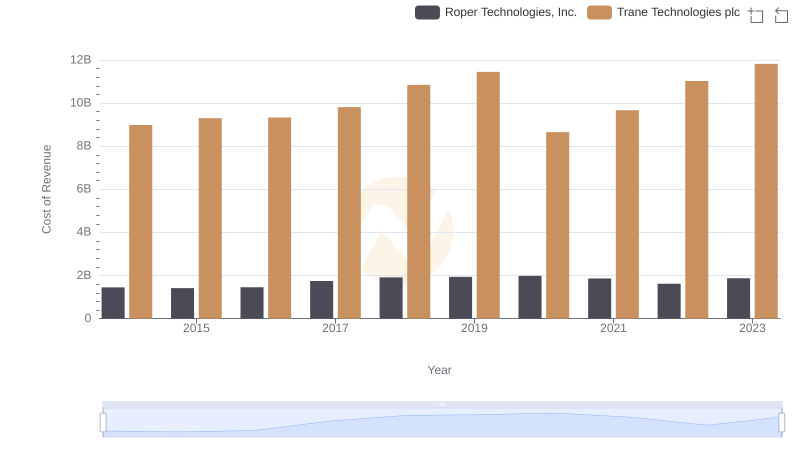
Cost of Revenue Comparison: Trane Technologies plc vs Roper Technologies, Inc.
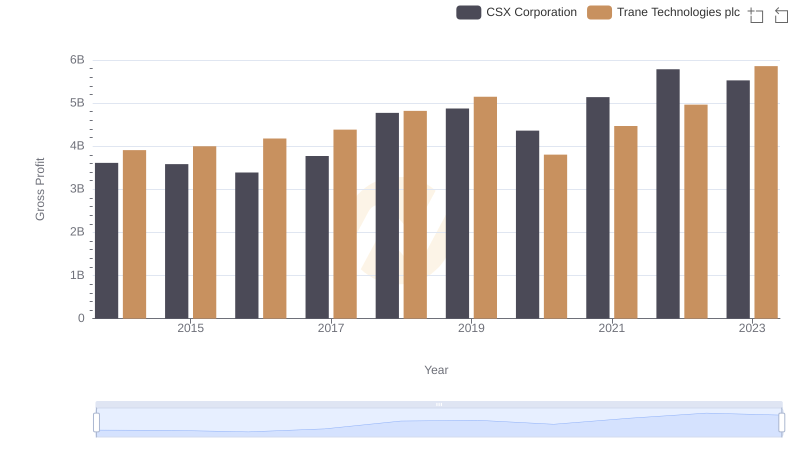
Gross Profit Trends Compared: Trane Technologies plc vs CSX Corporation
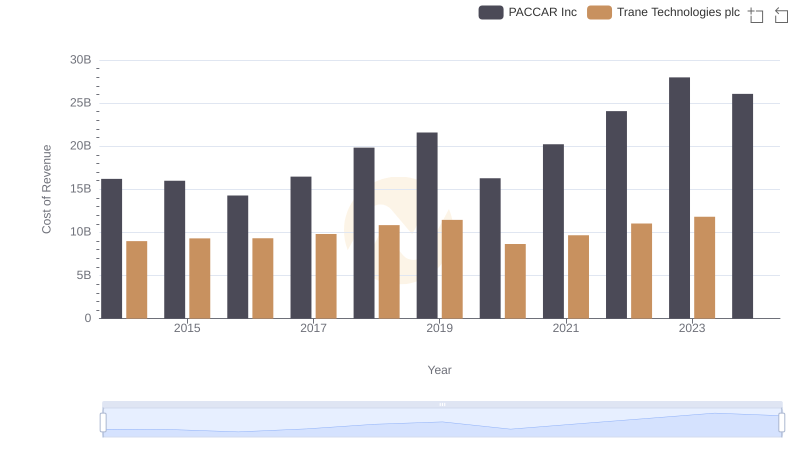
Cost Insights: Breaking Down Trane Technologies plc and PACCAR Inc's Expenses
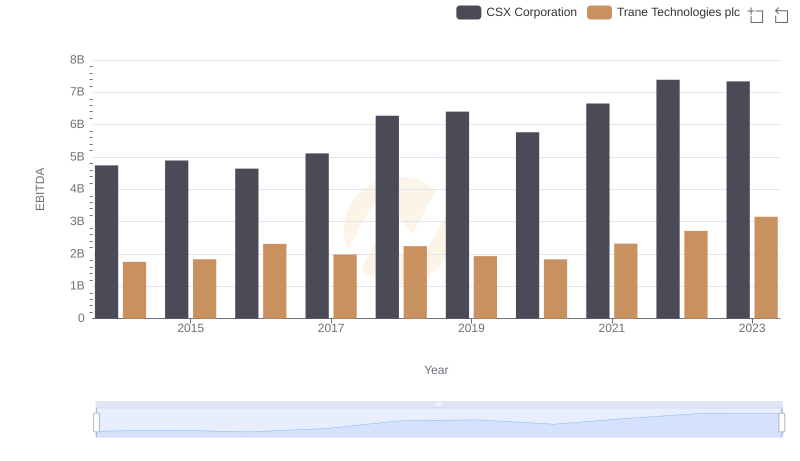
EBITDA Performance Review: Trane Technologies plc vs CSX Corporation