| __timestamp | Roper Technologies, Inc. | Trane Technologies plc |
|---|---|---|
| Wednesday, January 1, 2014 | 1447595000 | 8982800000 |
| Thursday, January 1, 2015 | 1417749000 | 9301600000 |
| Friday, January 1, 2016 | 1457515000 | 9329300000 |
| Sunday, January 1, 2017 | 1742675000 | 9811600000 |
| Monday, January 1, 2018 | 1911700000 | 10847600000 |
| Tuesday, January 1, 2019 | 1939700000 | 11451500000 |
| Wednesday, January 1, 2020 | 1984100000 | 8651300000 |
| Friday, January 1, 2021 | 1860400000 | 9666800000 |
| Saturday, January 1, 2022 | 1619000000 | 11026900000 |
| Sunday, January 1, 2023 | 1870600000 | 11820400000 |
| Monday, January 1, 2024 | 2160900000 | 12757700000 |
In pursuit of knowledge
In the competitive landscape of industrial technology, Trane Technologies plc and Roper Technologies, Inc. have carved out significant niches. Over the past decade, Trane Technologies has consistently outpaced Roper Technologies in terms of cost of revenue, with figures often exceeding Roper's by over 500%. This trend highlights Trane's expansive operations and market reach.
From 2014 to 2023, Trane Technologies saw its cost of revenue grow from approximately $9 billion to over $11 billion, reflecting a robust expansion strategy. In contrast, Roper Technologies maintained a steadier trajectory, with costs hovering around $1.5 billion to $2 billion. Notably, 2020 marked a dip for Trane, likely due to global disruptions, but the company rebounded strongly in subsequent years.
This comparison underscores the differing operational scales and strategies of these two industry leaders, offering valuable insights for investors and analysts alike.
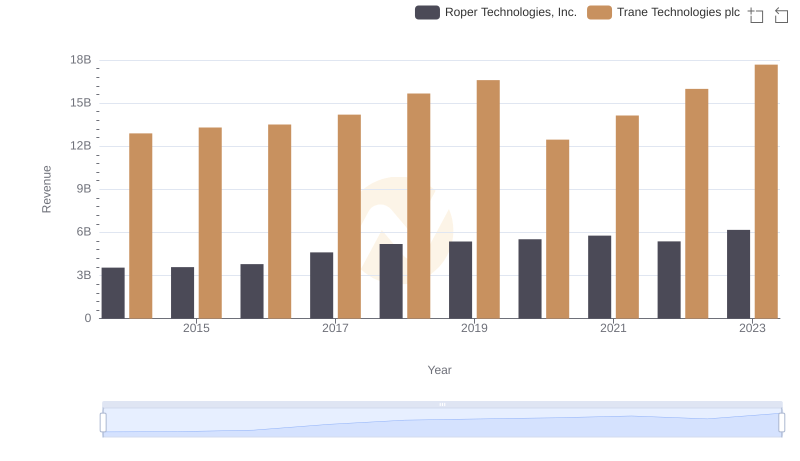
Trane Technologies plc vs Roper Technologies, Inc.: Examining Key Revenue Metrics
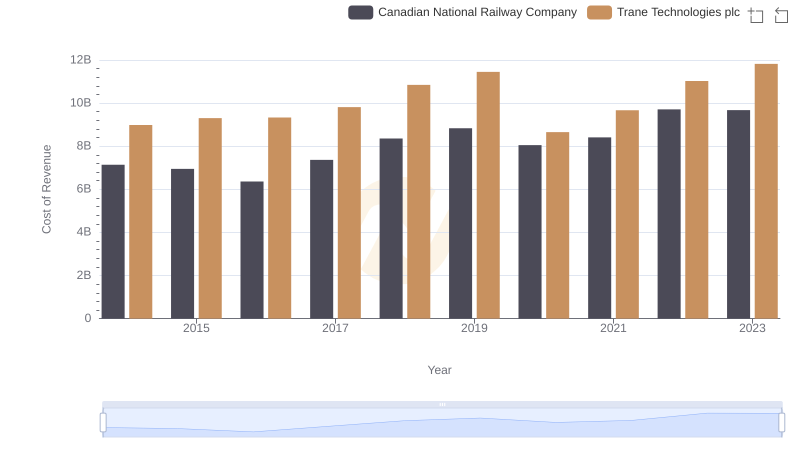
Cost of Revenue Comparison: Trane Technologies plc vs Canadian National Railway Company
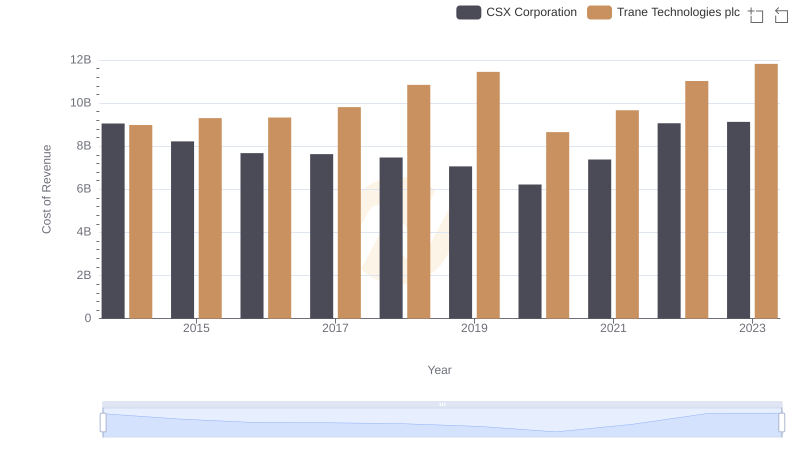
Cost of Revenue Trends: Trane Technologies plc vs CSX Corporation
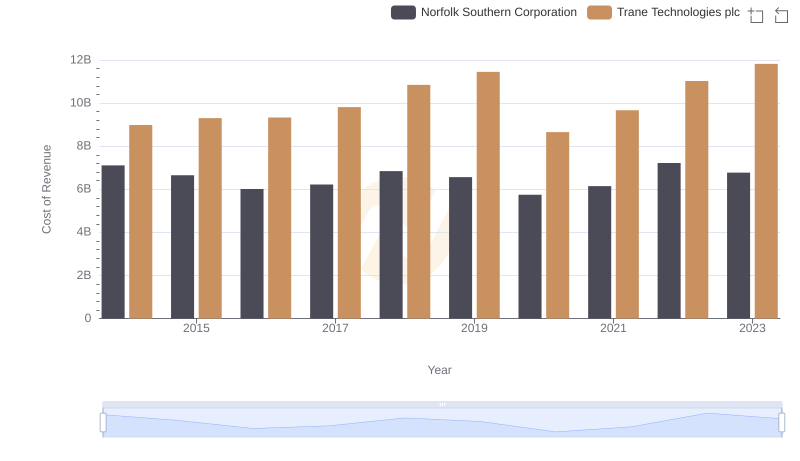
Analyzing Cost of Revenue: Trane Technologies plc and Norfolk Southern Corporation
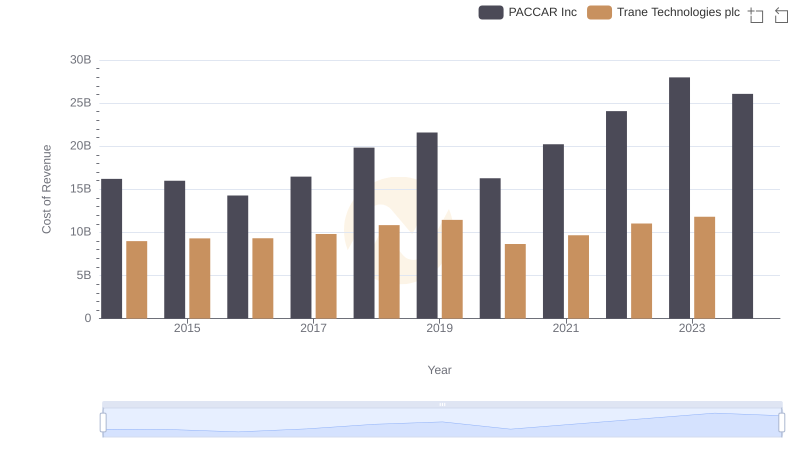
Cost Insights: Breaking Down Trane Technologies plc and PACCAR Inc's Expenses
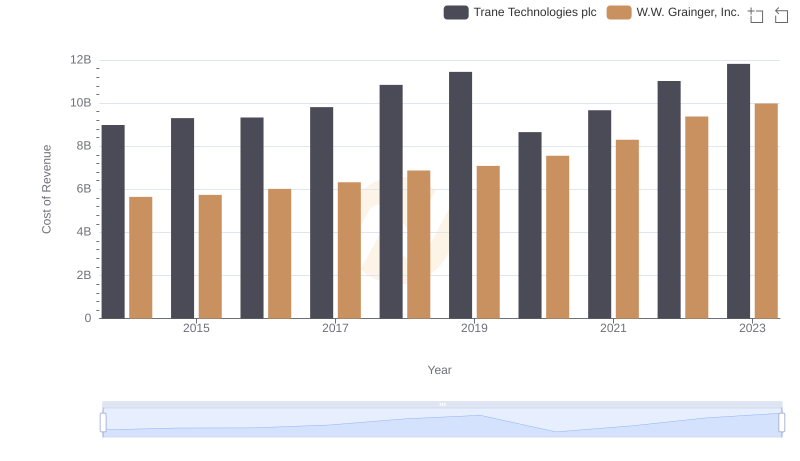
Cost Insights: Breaking Down Trane Technologies plc and W.W. Grainger, Inc.'s Expenses
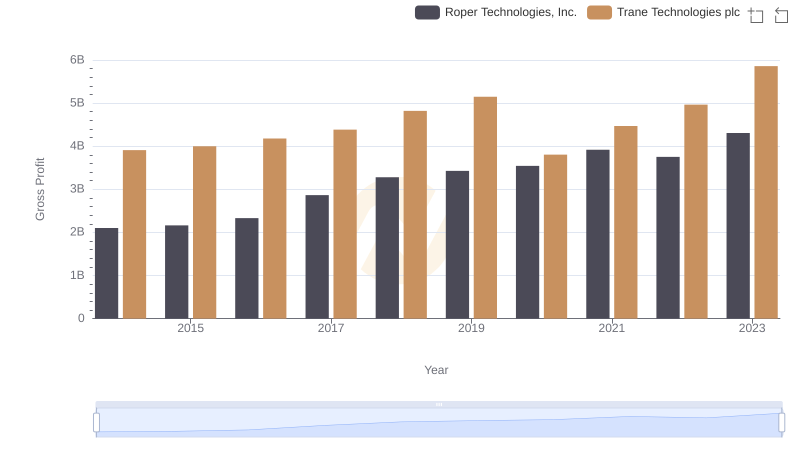
Trane Technologies plc vs Roper Technologies, Inc.: A Gross Profit Performance Breakdown
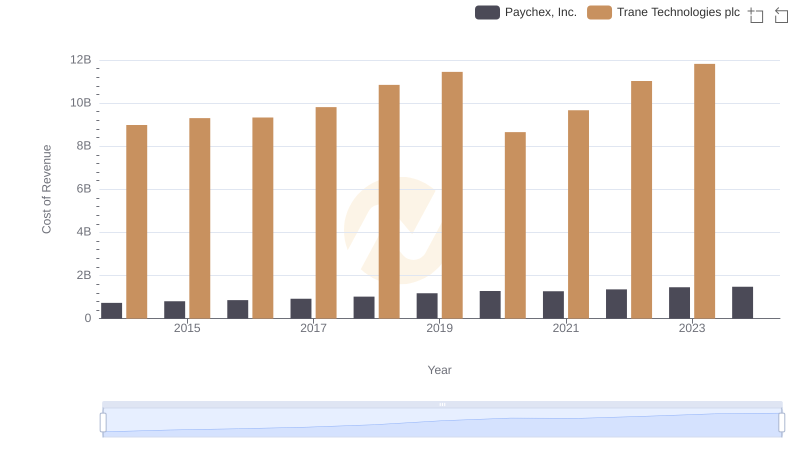
Cost Insights: Breaking Down Trane Technologies plc and Paychex, Inc.'s Expenses
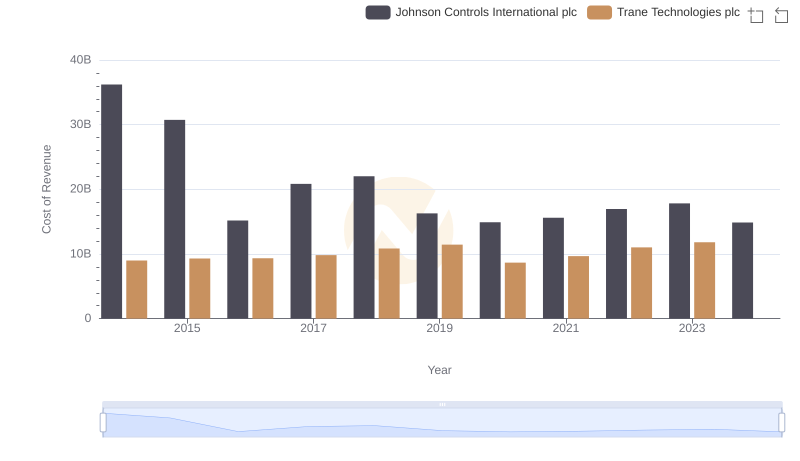
Cost of Revenue Comparison: Trane Technologies plc vs Johnson Controls International plc
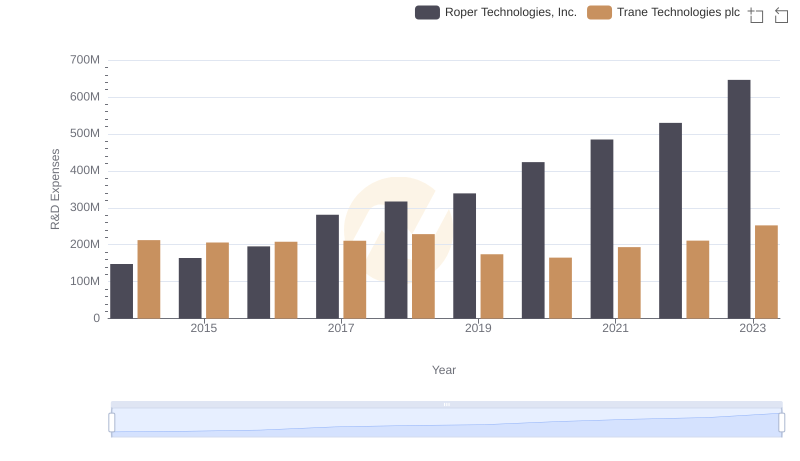
Trane Technologies plc or Roper Technologies, Inc.: Who Invests More in Innovation?
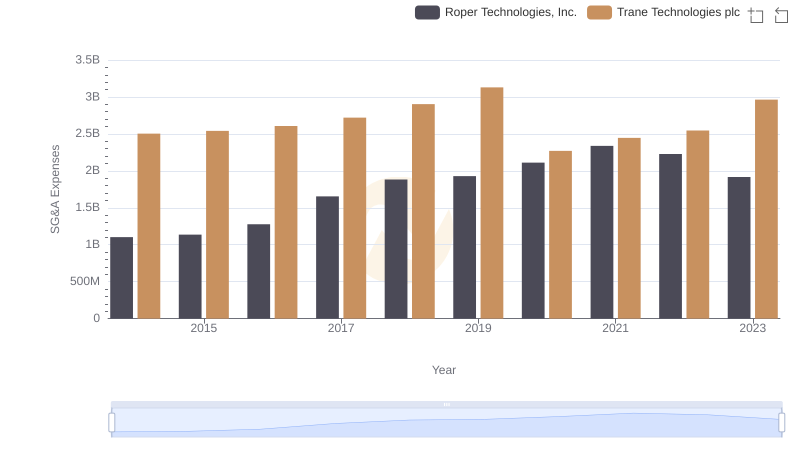
Trane Technologies plc or Roper Technologies, Inc.: Who Manages SG&A Costs Better?
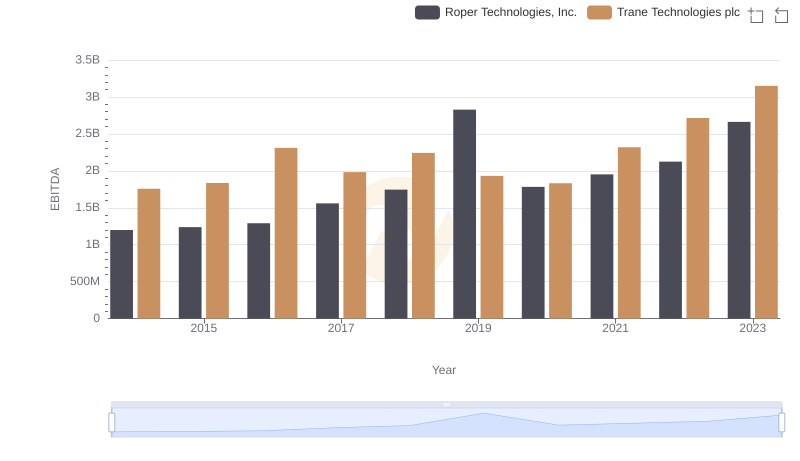
A Side-by-Side Analysis of EBITDA: Trane Technologies plc and Roper Technologies, Inc.