| __timestamp | Canadian National Railway Company | Trane Technologies plc |
|---|---|---|
| Wednesday, January 1, 2014 | 5674000000 | 1757000000 |
| Thursday, January 1, 2015 | 6424000000 | 1835000000 |
| Friday, January 1, 2016 | 6537000000 | 2311000000 |
| Sunday, January 1, 2017 | 6839000000 | 1982500000 |
| Monday, January 1, 2018 | 7124000000 | 2242400000 |
| Tuesday, January 1, 2019 | 7999000000 | 1931200000 |
| Wednesday, January 1, 2020 | 7652000000 | 1831900000 |
| Friday, January 1, 2021 | 7607000000 | 2319200000 |
| Saturday, January 1, 2022 | 9067000000 | 2715500000 |
| Sunday, January 1, 2023 | 9027000000 | 3149900000 |
| Monday, January 1, 2024 | 3859600000 |
Cracking the code
In the ever-evolving landscape of global business, understanding the financial health of industry giants is crucial. This analysis delves into the EBITDA performance of Trane Technologies plc and Canadian National Railway Company from 2014 to 2023. Over this period, Canadian National Railway consistently outperformed, with an average EBITDA approximately 3.4 times higher than Trane Technologies. Notably, Canadian National Railway's EBITDA peaked in 2022, marking a 60% increase from 2014, reflecting its robust operational efficiency and strategic growth.
Conversely, Trane Technologies showed a steady upward trajectory, culminating in a 79% rise in EBITDA by 2023 compared to 2014. This growth underscores its resilience and adaptability in a competitive market. As we navigate through economic uncertainties, these insights offer a glimpse into the strategic maneuvers that define industry leaders.
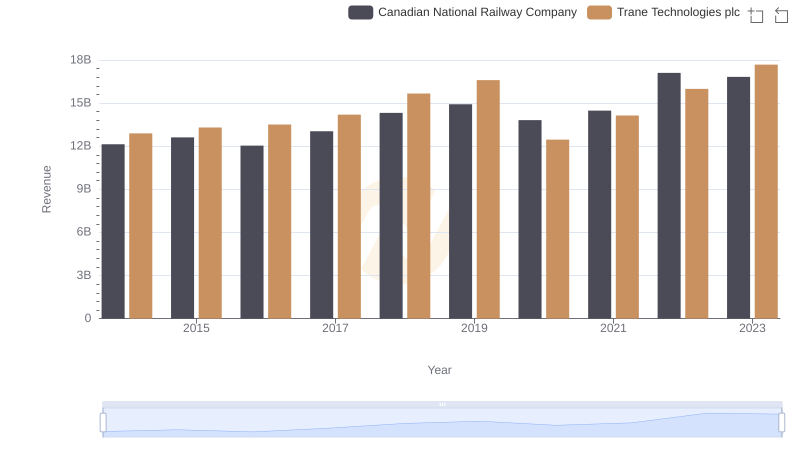
Trane Technologies plc and Canadian National Railway Company: A Comprehensive Revenue Analysis
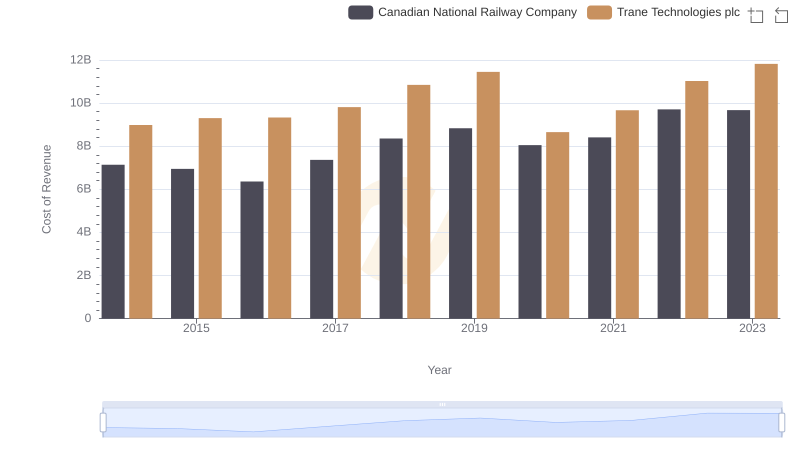
Cost of Revenue Comparison: Trane Technologies plc vs Canadian National Railway Company

Gross Profit Analysis: Comparing Trane Technologies plc and Canadian National Railway Company
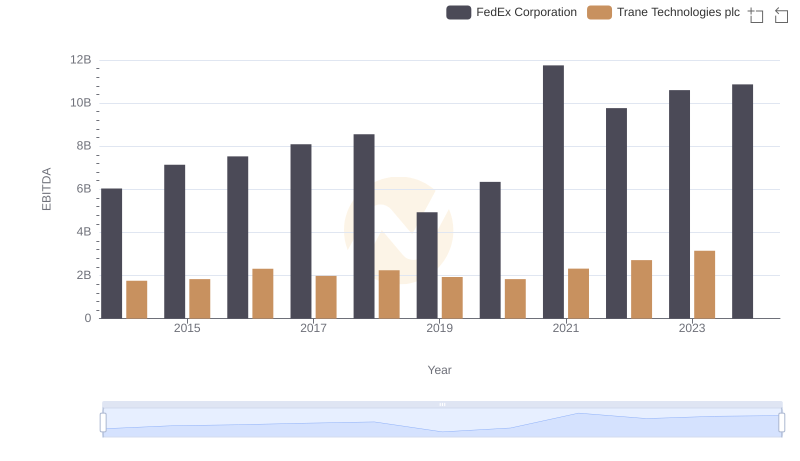
EBITDA Performance Review: Trane Technologies plc vs FedEx Corporation
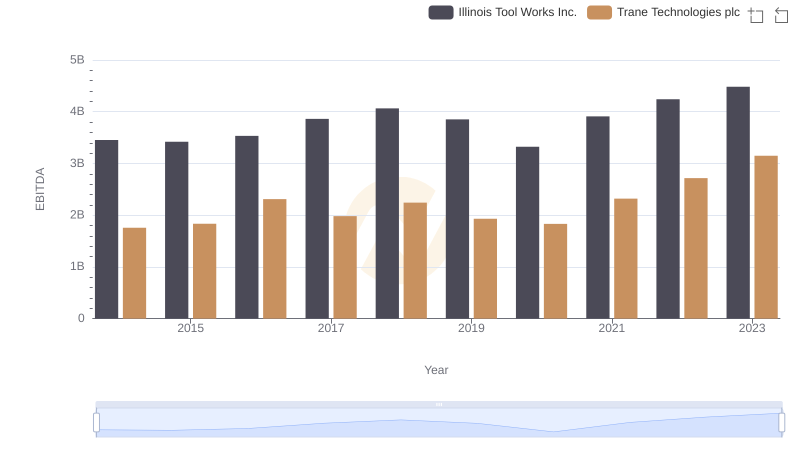
EBITDA Performance Review: Trane Technologies plc vs Illinois Tool Works Inc.
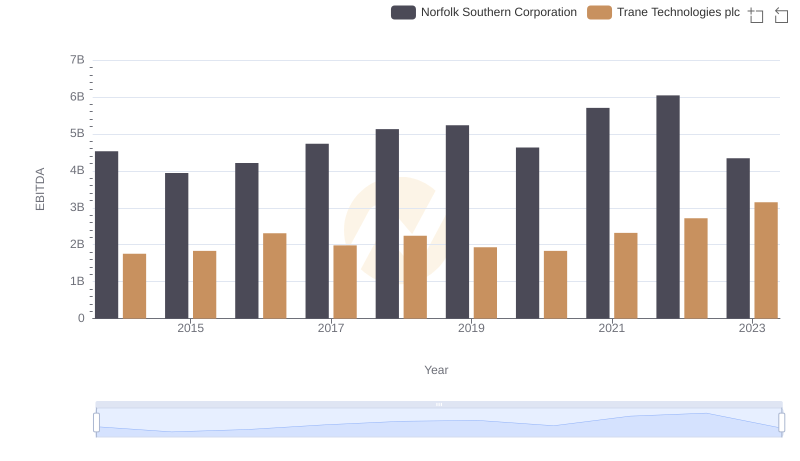
EBITDA Analysis: Evaluating Trane Technologies plc Against Norfolk Southern Corporation
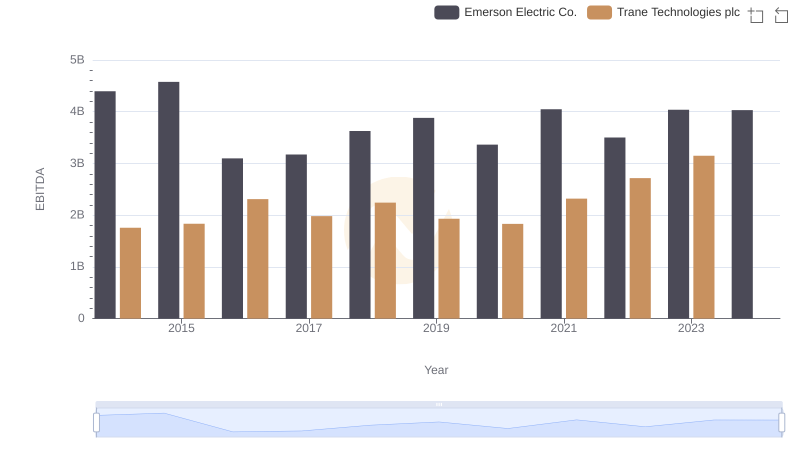
Comparative EBITDA Analysis: Trane Technologies plc vs Emerson Electric Co.
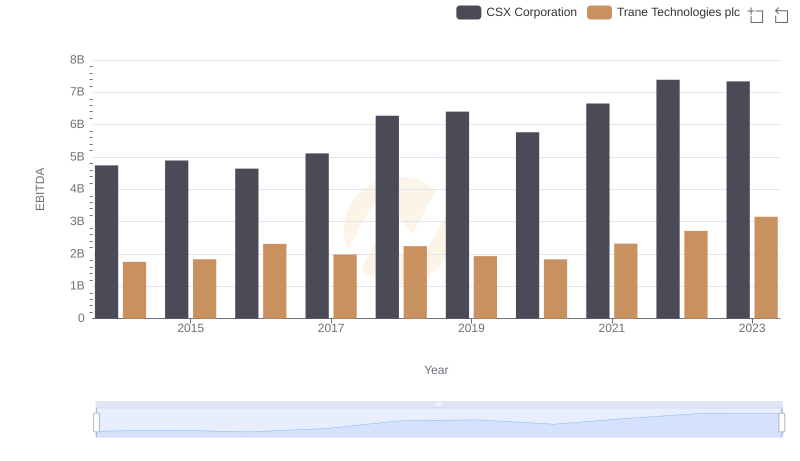
EBITDA Performance Review: Trane Technologies plc vs CSX Corporation
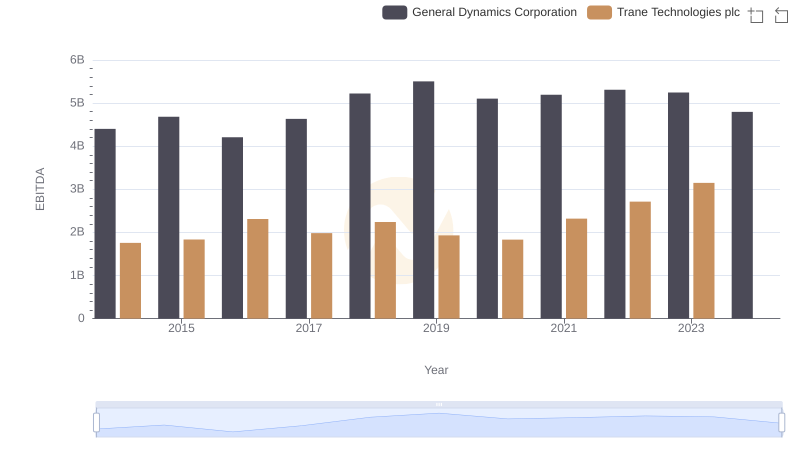
Professional EBITDA Benchmarking: Trane Technologies plc vs General Dynamics Corporation
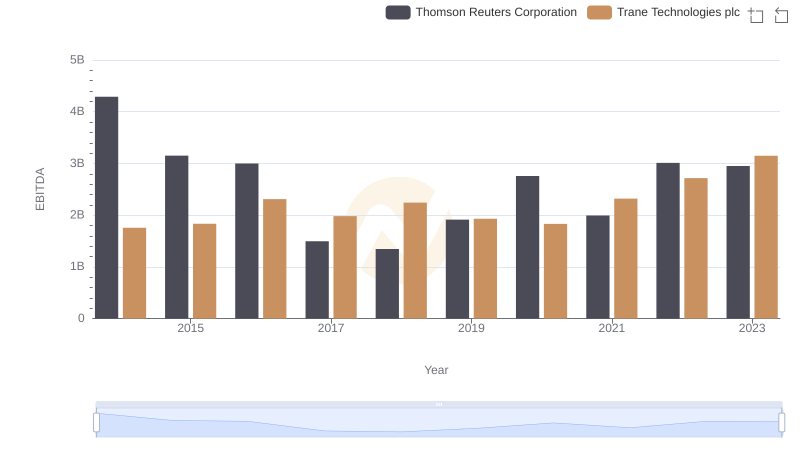
A Side-by-Side Analysis of EBITDA: Trane Technologies plc and Thomson Reuters Corporation