| __timestamp | Intuit Inc. | Super Micro Computer, Inc. |
|---|---|---|
| Wednesday, January 1, 2014 | 668000000 | 1241657000 |
| Thursday, January 1, 2015 | 725000000 | 1670924000 |
| Friday, January 1, 2016 | 752000000 | 1884048000 |
| Sunday, January 1, 2017 | 809000000 | 2171349000 |
| Monday, January 1, 2018 | 977000000 | 2930498000 |
| Tuesday, January 1, 2019 | 1167000000 | 3004838000 |
| Wednesday, January 1, 2020 | 1378000000 | 2813071000 |
| Friday, January 1, 2021 | 1683000000 | 3022884000 |
| Saturday, January 1, 2022 | 2406000000 | 4396098000 |
| Sunday, January 1, 2023 | 3143000000 | 5840470000 |
| Monday, January 1, 2024 | 3465000000 | 12831125000 |
Unveiling the hidden dimensions of data
In the ever-evolving landscape of technology, understanding the cost dynamics of leading companies is crucial. From 2014 to 2024, Intuit Inc. and Super Micro Computer, Inc. have shown significant shifts in their cost of revenue. Intuit Inc. has seen a steady increase, with costs rising by over 400% from 2014 to 2024. This growth reflects their expanding market presence and investment in innovation. Meanwhile, Super Micro Computer, Inc. has experienced an even more dramatic surge, with costs increasing by over 900% in the same period, highlighting their aggressive expansion and scaling strategies.
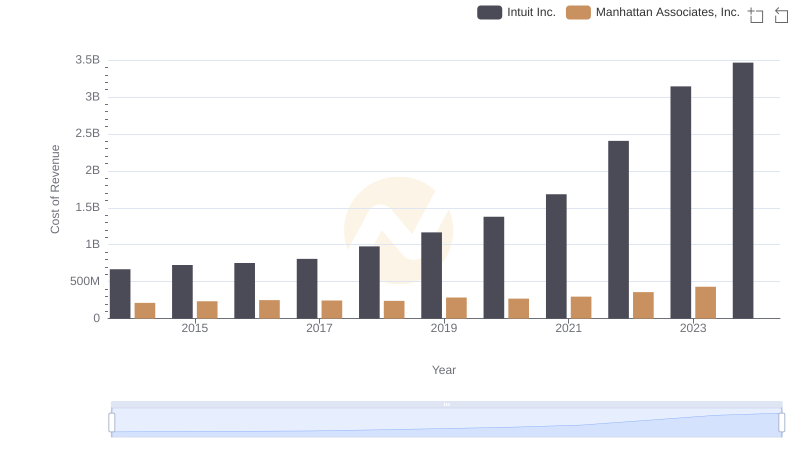
Analyzing Cost of Revenue: Intuit Inc. and Manhattan Associates, Inc.
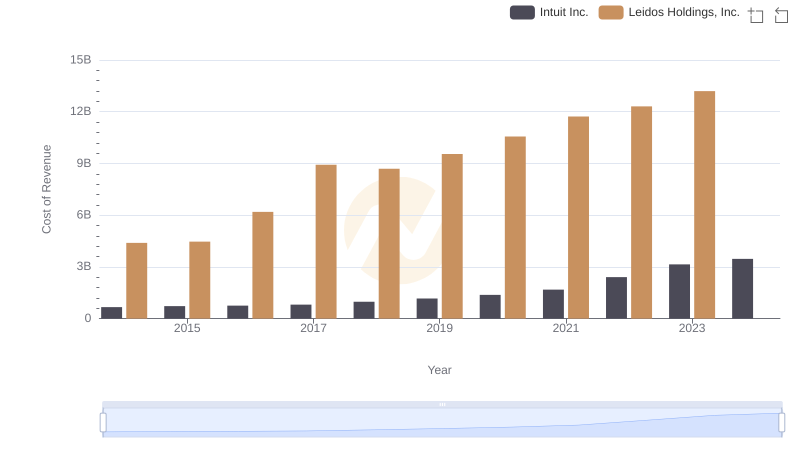
Intuit Inc. vs Leidos Holdings, Inc.: Efficiency in Cost of Revenue Explored
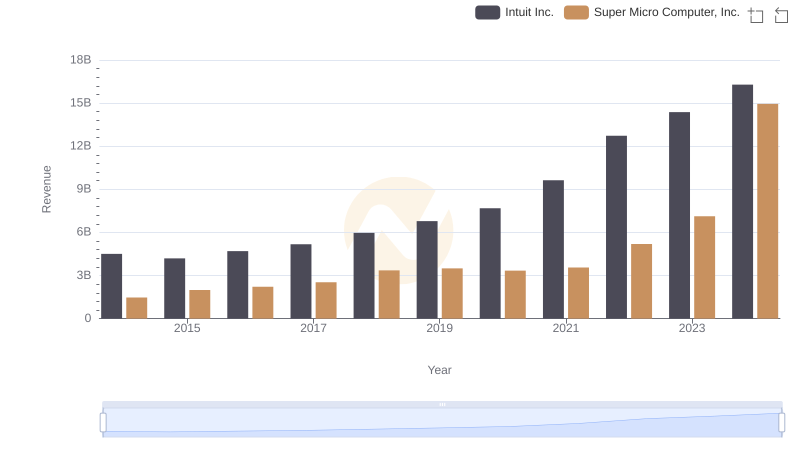
Breaking Down Revenue Trends: Intuit Inc. vs Super Micro Computer, Inc.
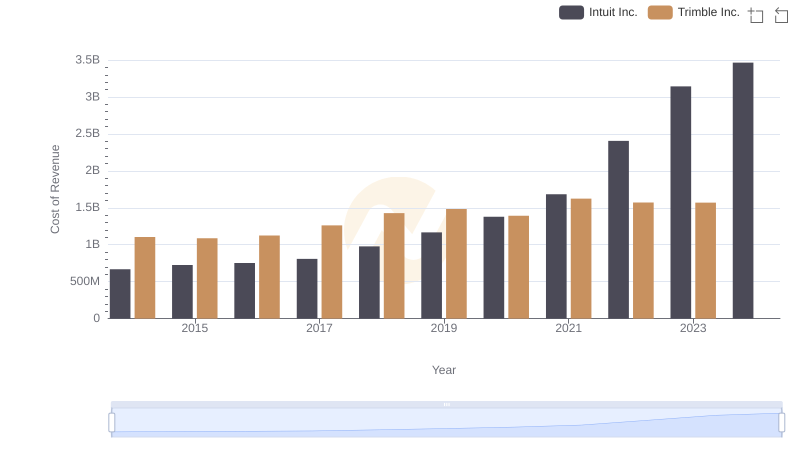
Comparing Cost of Revenue Efficiency: Intuit Inc. vs Trimble Inc.
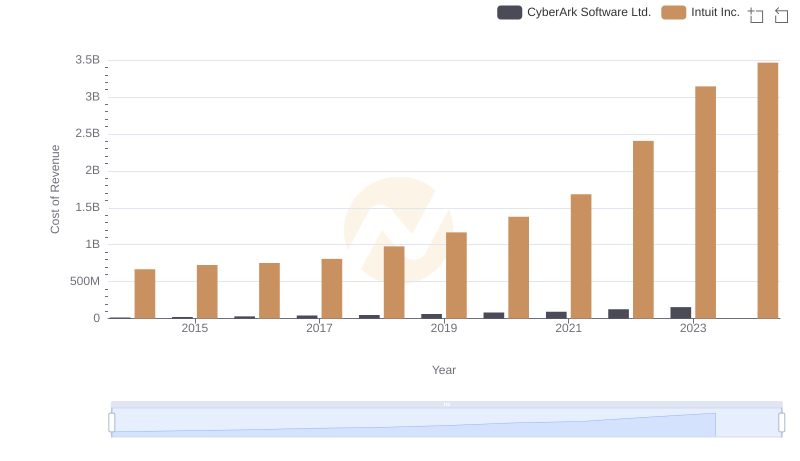
Cost of Revenue Trends: Intuit Inc. vs CyberArk Software Ltd.
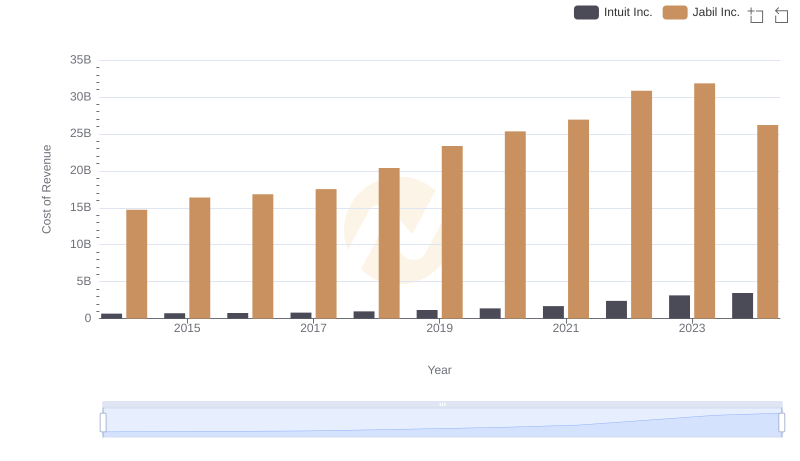
Cost Insights: Breaking Down Intuit Inc. and Jabil Inc.'s Expenses
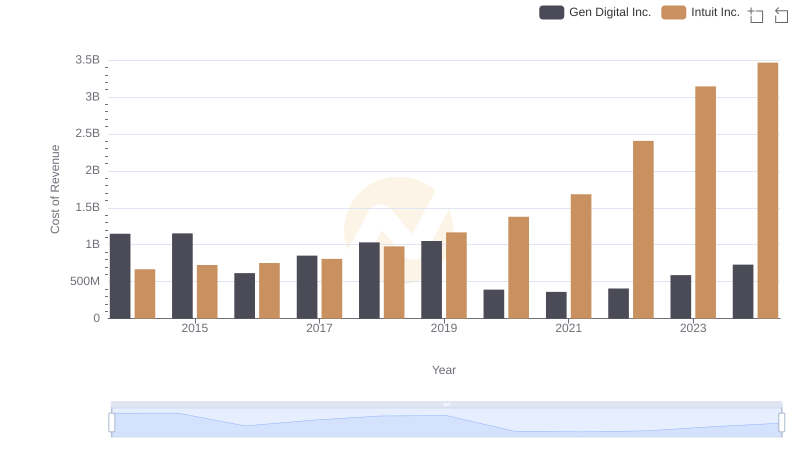
Comparing Cost of Revenue Efficiency: Intuit Inc. vs Gen Digital Inc.
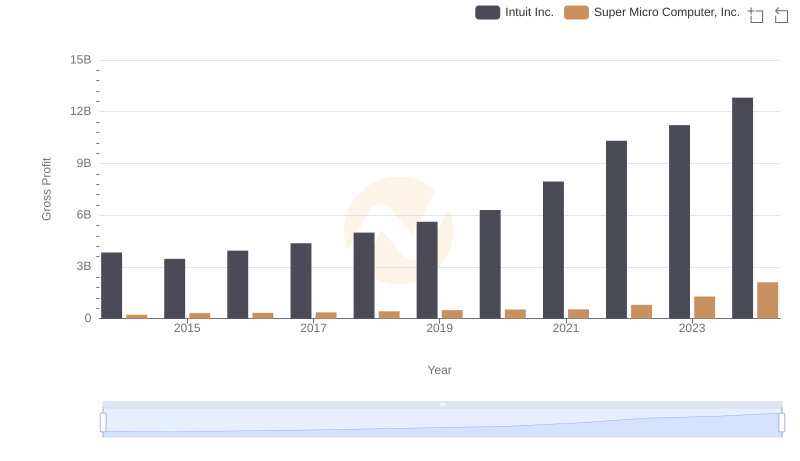
Gross Profit Analysis: Comparing Intuit Inc. and Super Micro Computer, Inc.
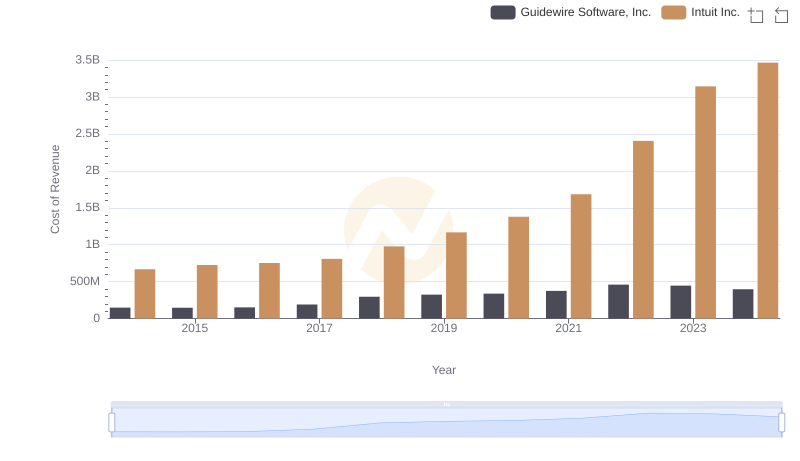
Analyzing Cost of Revenue: Intuit Inc. and Guidewire Software, Inc.
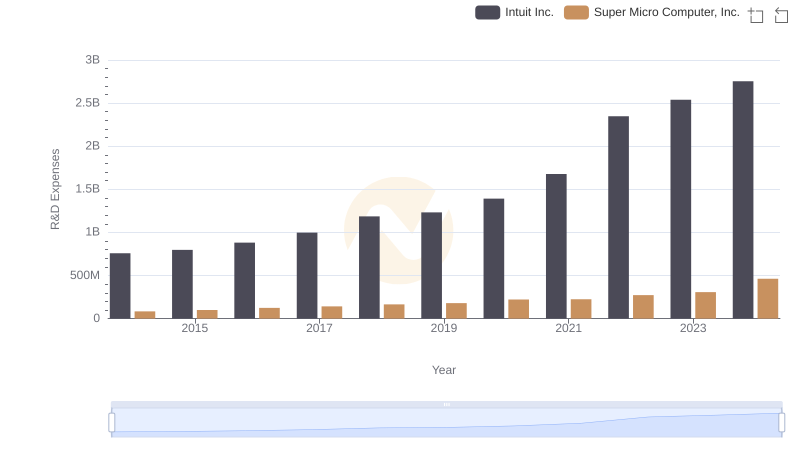
Intuit Inc. or Super Micro Computer, Inc.: Who Invests More in Innovation?
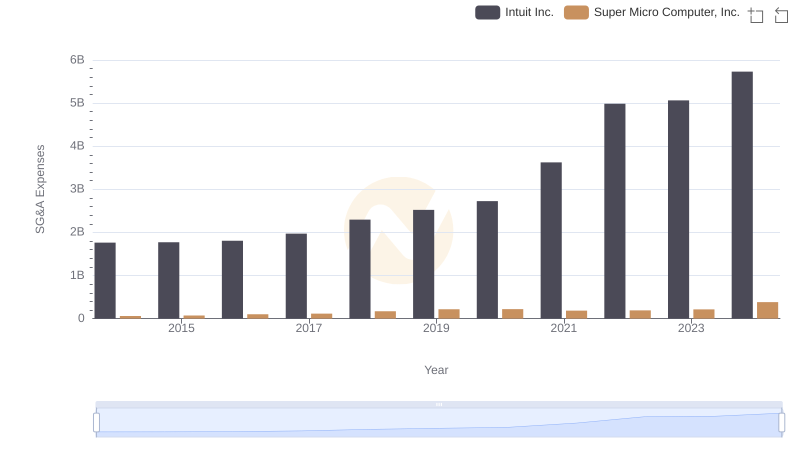
Operational Costs Compared: SG&A Analysis of Intuit Inc. and Super Micro Computer, Inc.
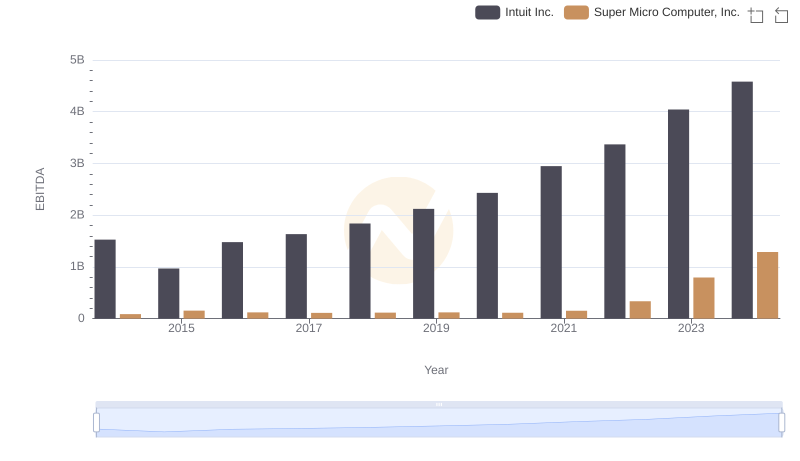
A Side-by-Side Analysis of EBITDA: Intuit Inc. and Super Micro Computer, Inc.