| __timestamp | Intuit Inc. | Manhattan Associates, Inc. |
|---|---|---|
| Wednesday, January 1, 2014 | 668000000 | 212578000 |
| Thursday, January 1, 2015 | 725000000 | 235428000 |
| Friday, January 1, 2016 | 752000000 | 249879000 |
| Sunday, January 1, 2017 | 809000000 | 245733000 |
| Monday, January 1, 2018 | 977000000 | 240881000 |
| Tuesday, January 1, 2019 | 1167000000 | 284967000 |
| Wednesday, January 1, 2020 | 1378000000 | 269887000 |
| Friday, January 1, 2021 | 1683000000 | 297827000 |
| Saturday, January 1, 2022 | 2406000000 | 358237000 |
| Sunday, January 1, 2023 | 3143000000 | 430614000 |
| Monday, January 1, 2024 | 3465000000 | 470980000 |
Infusing magic into the data realm
In the ever-evolving landscape of financial technology and software solutions, understanding the cost dynamics is crucial. Over the past decade, Intuit Inc. and Manhattan Associates, Inc. have showcased distinct trajectories in their cost of revenue. From 2014 to 2023, Intuit's cost of revenue surged by over 400%, reflecting its aggressive expansion and investment in product development. In contrast, Manhattan Associates experienced a more modest increase of approximately 100%, indicating a steady yet cautious growth strategy.
The data reveals that Intuit's cost of revenue consistently outpaced that of Manhattan Associates, with a notable spike in 2023, reaching a peak of $3.1 billion. This trend underscores Intuit's commitment to scaling its operations and enhancing its market presence. Meanwhile, Manhattan Associates maintained a stable cost structure, peaking at $430 million in 2023. The absence of data for 2024 suggests potential shifts in strategy or reporting practices.
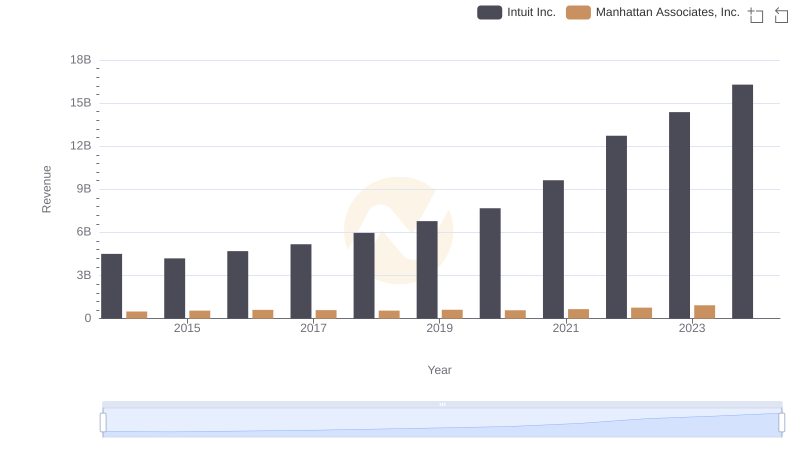
Annual Revenue Comparison: Intuit Inc. vs Manhattan Associates, Inc.

Cost of Revenue Comparison: Intuit Inc. vs Teradyne, Inc.
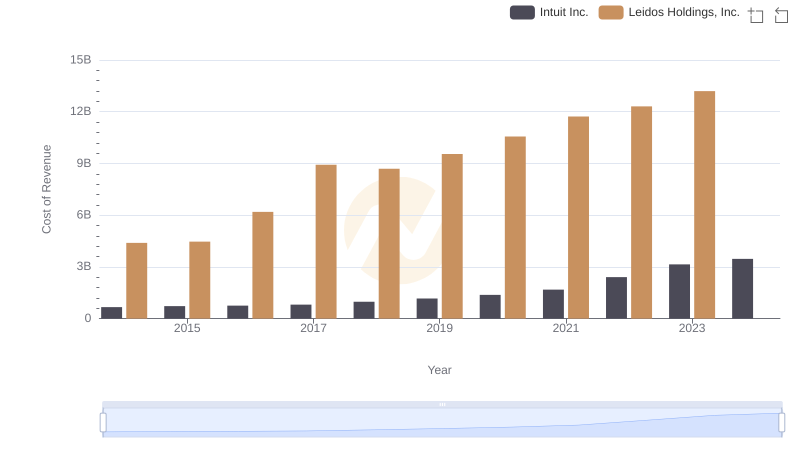
Intuit Inc. vs Leidos Holdings, Inc.: Efficiency in Cost of Revenue Explored
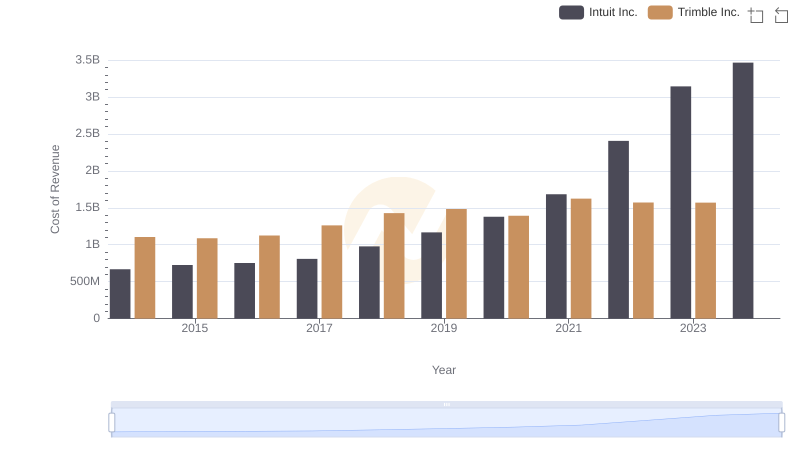
Comparing Cost of Revenue Efficiency: Intuit Inc. vs Trimble Inc.
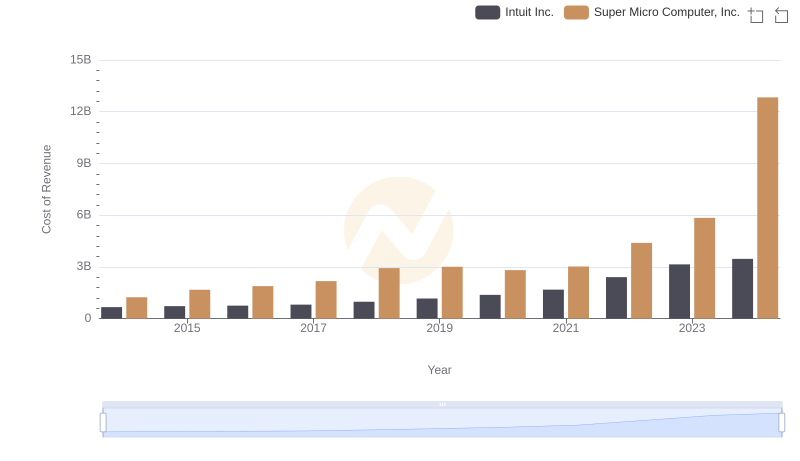
Cost of Revenue: Key Insights for Intuit Inc. and Super Micro Computer, Inc.
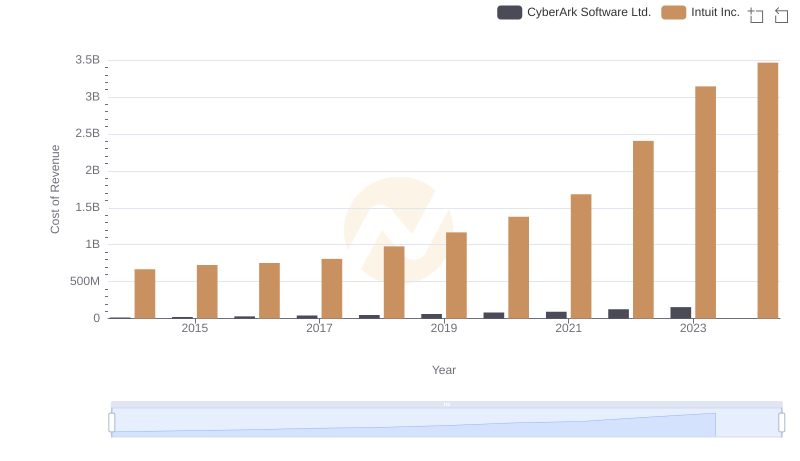
Cost of Revenue Trends: Intuit Inc. vs CyberArk Software Ltd.
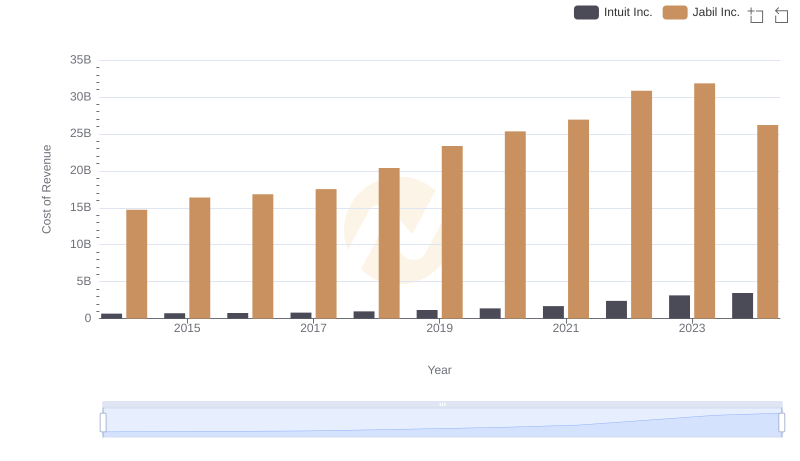
Cost Insights: Breaking Down Intuit Inc. and Jabil Inc.'s Expenses
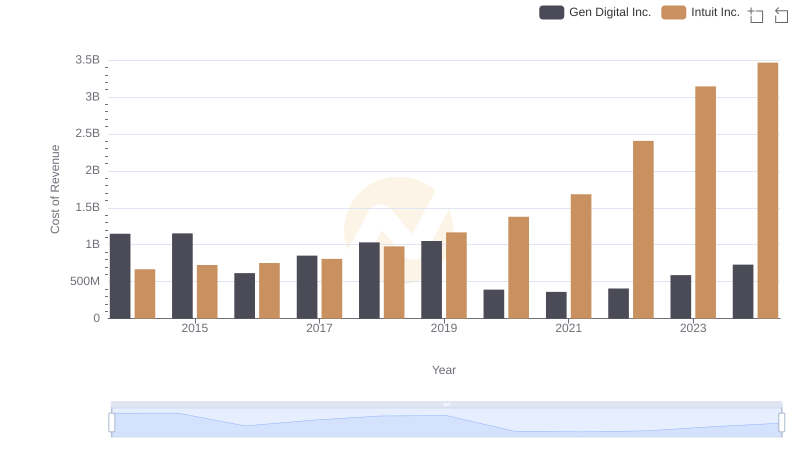
Comparing Cost of Revenue Efficiency: Intuit Inc. vs Gen Digital Inc.

Gross Profit Trends Compared: Intuit Inc. vs Manhattan Associates, Inc.
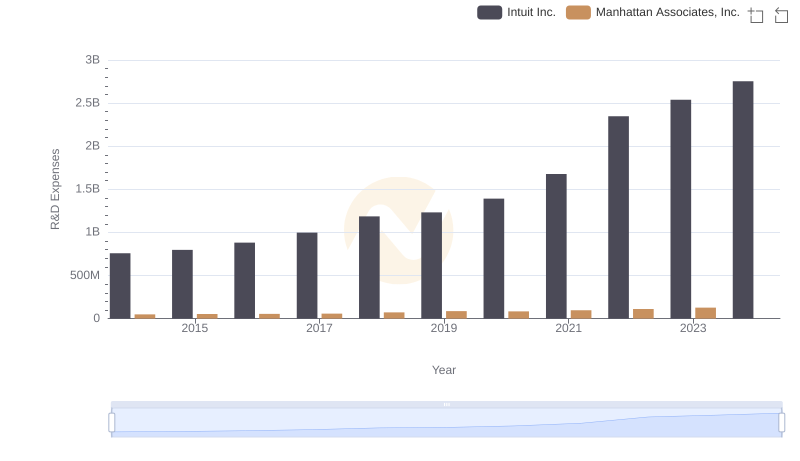
R&D Spending Showdown: Intuit Inc. vs Manhattan Associates, Inc.
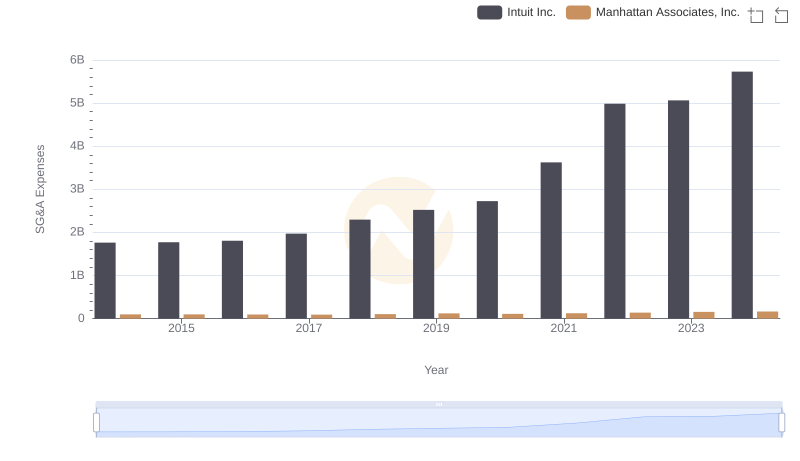
Intuit Inc. vs Manhattan Associates, Inc.: SG&A Expense Trends
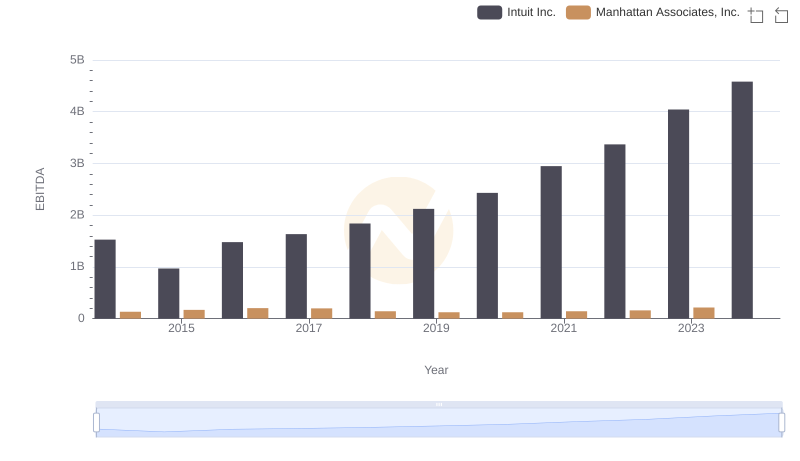
Comprehensive EBITDA Comparison: Intuit Inc. vs Manhattan Associates, Inc.