| __timestamp | Intuit Inc. | Jabil Inc. |
|---|---|---|
| Wednesday, January 1, 2014 | 668000000 | 14736543000 |
| Thursday, January 1, 2015 | 725000000 | 16395978000 |
| Friday, January 1, 2016 | 752000000 | 16825382000 |
| Sunday, January 1, 2017 | 809000000 | 17517478000 |
| Monday, January 1, 2018 | 977000000 | 20388624000 |
| Tuesday, January 1, 2019 | 1167000000 | 23368919000 |
| Wednesday, January 1, 2020 | 1378000000 | 25335625000 |
| Friday, January 1, 2021 | 1683000000 | 26926000000 |
| Saturday, January 1, 2022 | 2406000000 | 30846000000 |
| Sunday, January 1, 2023 | 3143000000 | 31835000000 |
| Monday, January 1, 2024 | 3465000000 | 26207000000 |
Unlocking the unknown
In the ever-evolving landscape of corporate finance, understanding cost structures is pivotal. This analysis delves into the cost of revenue for Intuit Inc. and Jabil Inc. from 2014 to 2024. Over this decade, Jabil Inc. consistently outpaced Intuit Inc. in terms of cost of revenue, reflecting its larger scale of operations. Notably, Jabil's cost of revenue peaked in 2023, reaching approximately 31.8 billion, a 116% increase from 2014. In contrast, Intuit's cost of revenue grew by 418% over the same period, highlighting its rapid expansion. The data reveals a significant upward trend for both companies, with Intuit's costs accelerating more sharply in recent years. This trend underscores the dynamic nature of these industries, where strategic investments and operational efficiencies are key to maintaining competitive advantage.
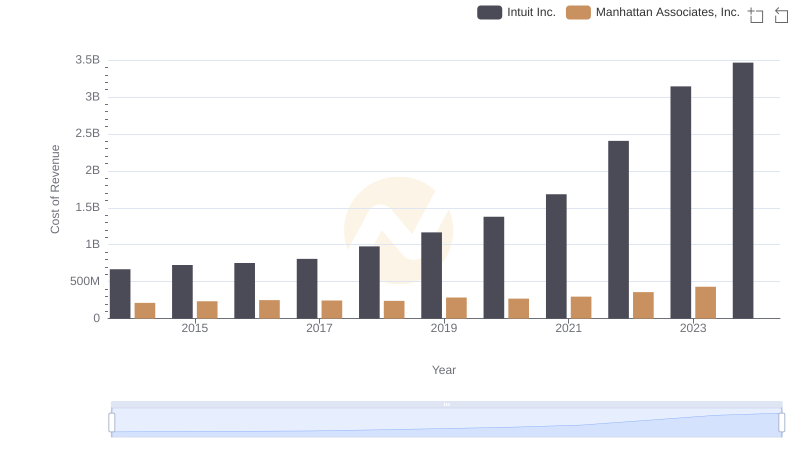
Analyzing Cost of Revenue: Intuit Inc. and Manhattan Associates, Inc.
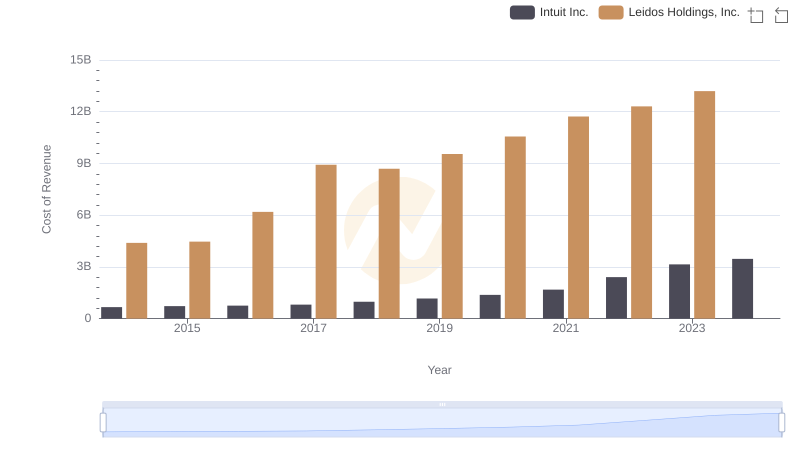
Intuit Inc. vs Leidos Holdings, Inc.: Efficiency in Cost of Revenue Explored
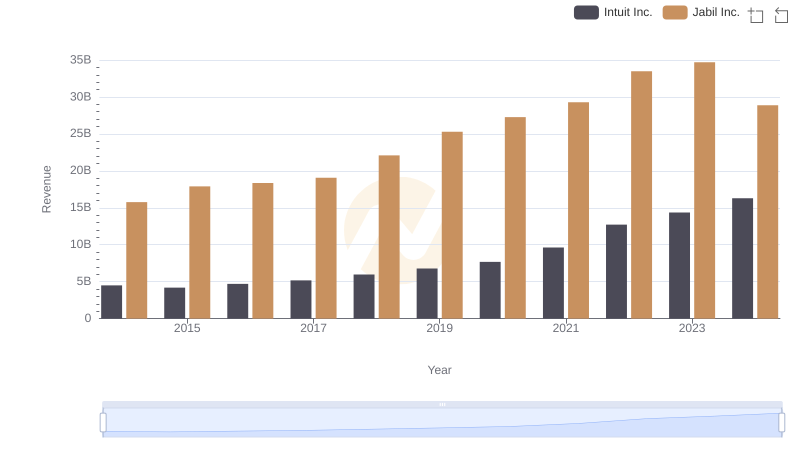
Intuit Inc. and Jabil Inc.: A Comprehensive Revenue Analysis
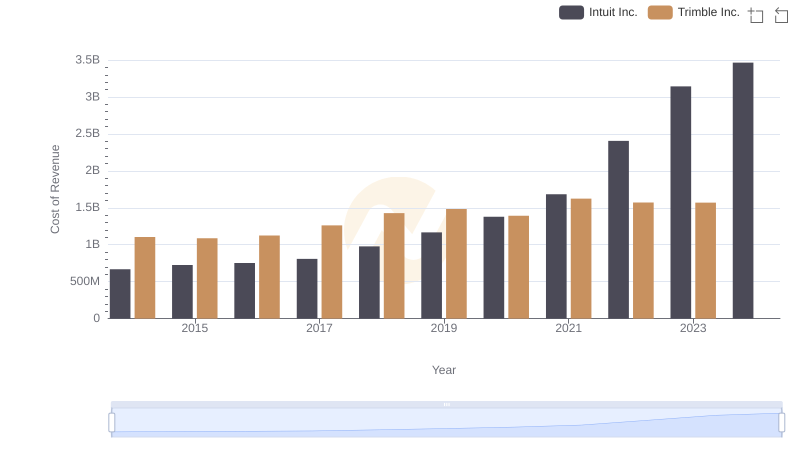
Comparing Cost of Revenue Efficiency: Intuit Inc. vs Trimble Inc.
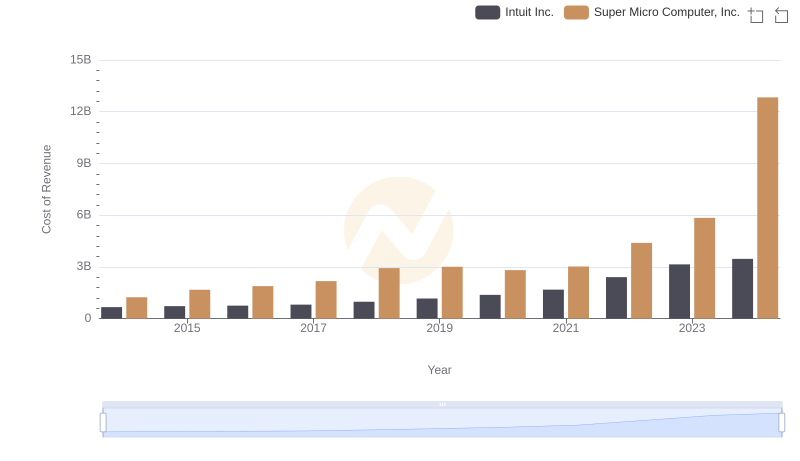
Cost of Revenue: Key Insights for Intuit Inc. and Super Micro Computer, Inc.
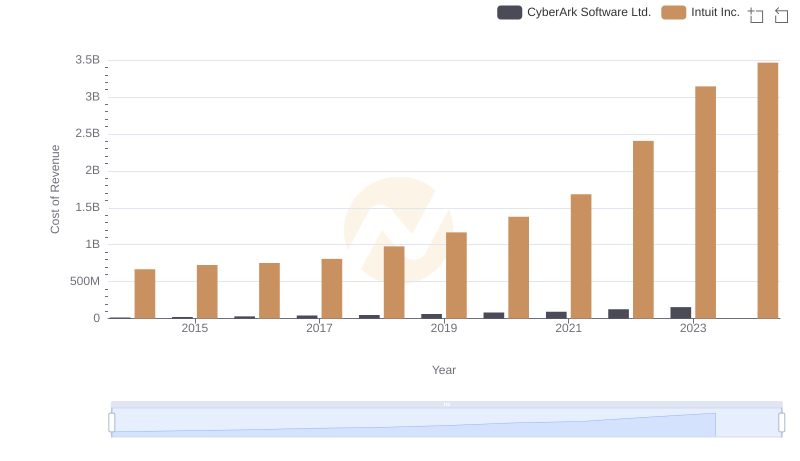
Cost of Revenue Trends: Intuit Inc. vs CyberArk Software Ltd.
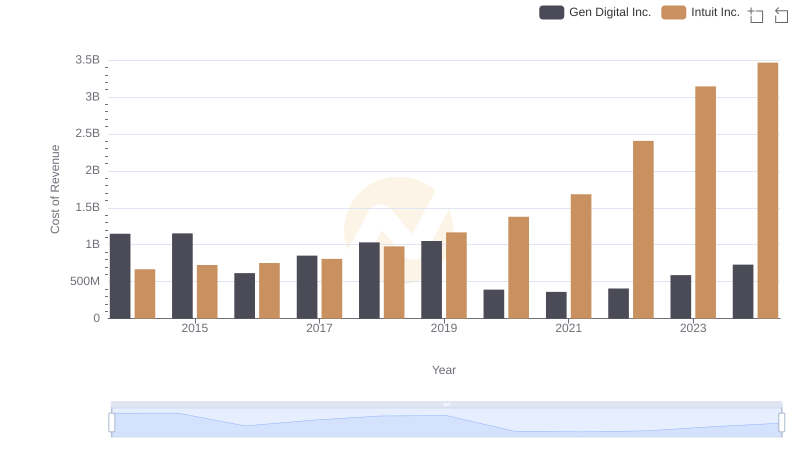
Comparing Cost of Revenue Efficiency: Intuit Inc. vs Gen Digital Inc.
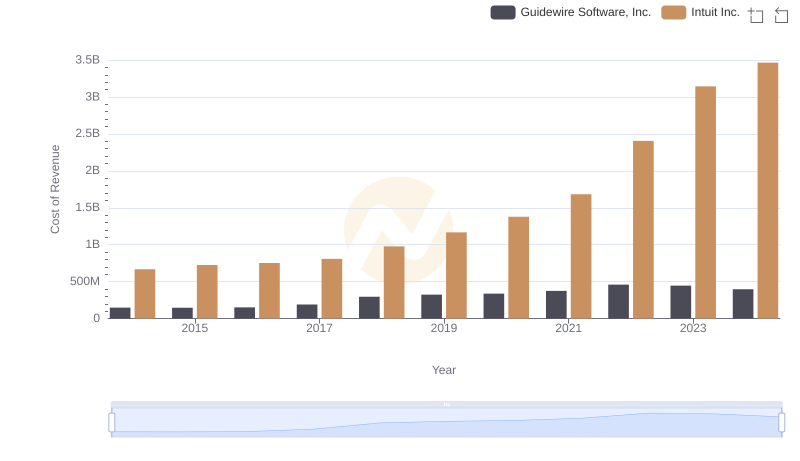
Analyzing Cost of Revenue: Intuit Inc. and Guidewire Software, Inc.
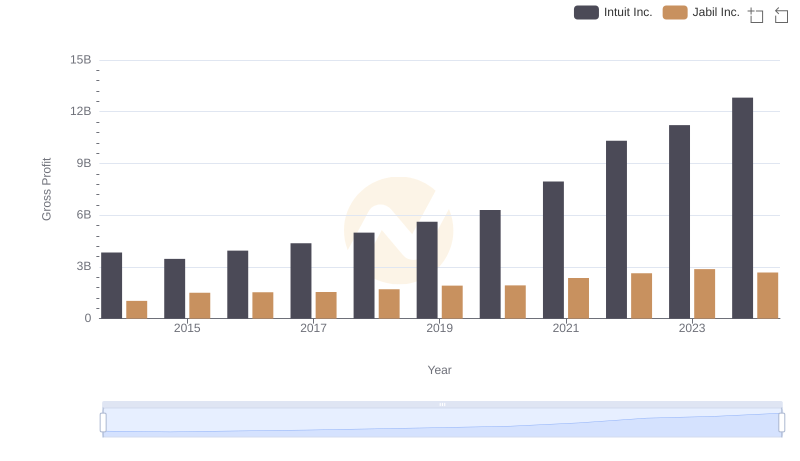
Gross Profit Trends Compared: Intuit Inc. vs Jabil Inc.
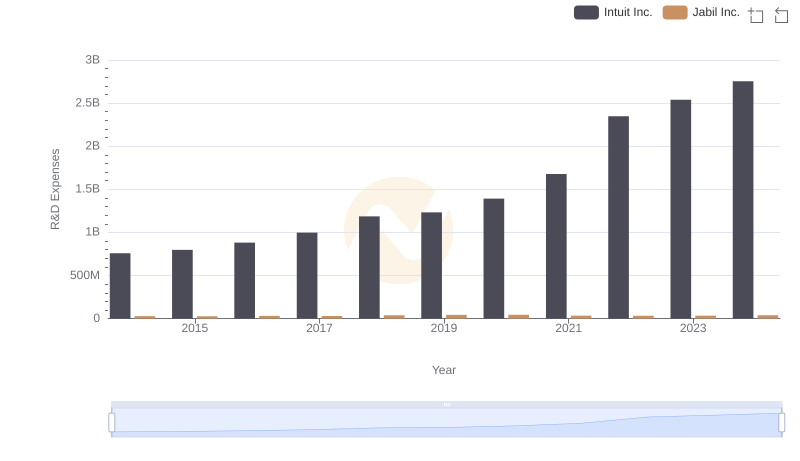
Research and Development: Comparing Key Metrics for Intuit Inc. and Jabil Inc.
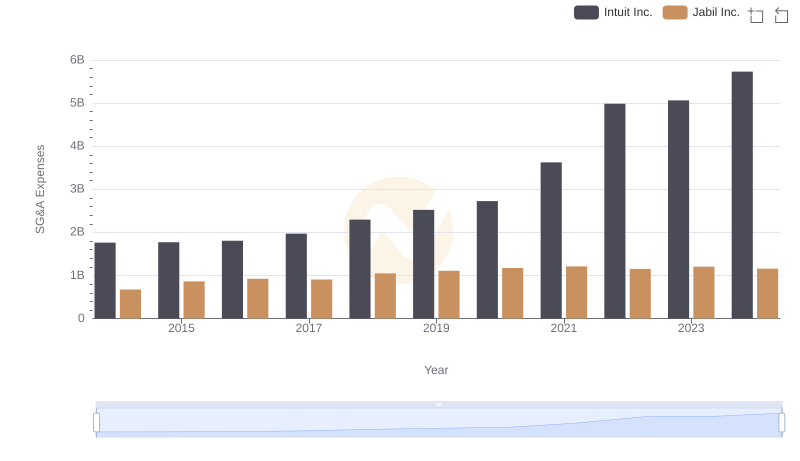
Intuit Inc. vs Jabil Inc.: SG&A Expense Trends
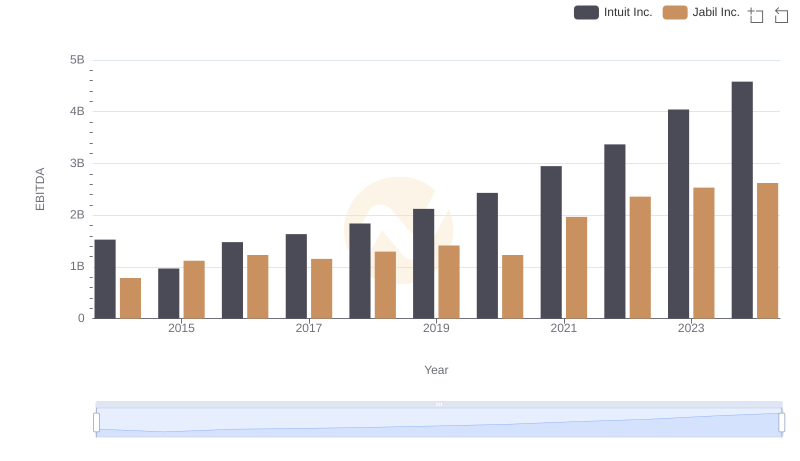
Comprehensive EBITDA Comparison: Intuit Inc. vs Jabil Inc.