| __timestamp | Intuit Inc. | Leidos Holdings, Inc. |
|---|---|---|
| Wednesday, January 1, 2014 | 668000000 | 4392000000 |
| Thursday, January 1, 2015 | 725000000 | 4468000000 |
| Friday, January 1, 2016 | 752000000 | 6191000000 |
| Sunday, January 1, 2017 | 809000000 | 8923000000 |
| Monday, January 1, 2018 | 977000000 | 8690000000 |
| Tuesday, January 1, 2019 | 1167000000 | 9546000000 |
| Wednesday, January 1, 2020 | 1378000000 | 10560000000 |
| Friday, January 1, 2021 | 1683000000 | 11723000000 |
| Saturday, January 1, 2022 | 2406000000 | 12312000000 |
| Sunday, January 1, 2023 | 3143000000 | 13194000000 |
| Monday, January 1, 2024 | 3465000000 | 13864000000 |
In pursuit of knowledge
In the ever-evolving landscape of corporate finance, understanding cost efficiency is paramount. This analysis delves into the cost of revenue trends for Intuit Inc. and Leidos Holdings, Inc. from 2014 to 2023. Over this decade, Intuit Inc. has seen a remarkable increase in its cost of revenue, growing by over 400%, from approximately $680 million in 2014 to $3.14 billion in 2023. In contrast, Leidos Holdings, Inc. has experienced a more stable growth, with its cost of revenue rising by about 200%, from $4.39 billion to $13.19 billion in the same period.
While both companies have shown growth, Intuit's cost of revenue has accelerated at a faster pace, indicating potential strategic shifts or market expansions. Notably, data for Leidos Holdings, Inc. in 2024 is missing, leaving room for speculation on future trends. This comparative analysis offers a window into the financial strategies of two industry giants.
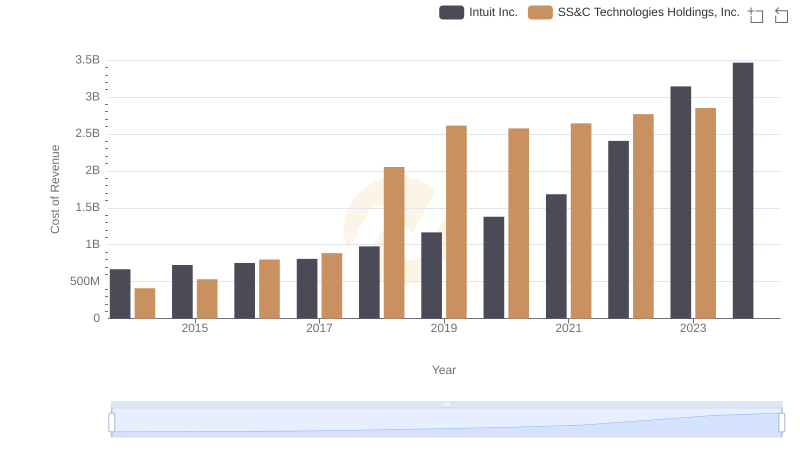
Cost of Revenue Trends: Intuit Inc. vs SS&C Technologies Holdings, Inc.
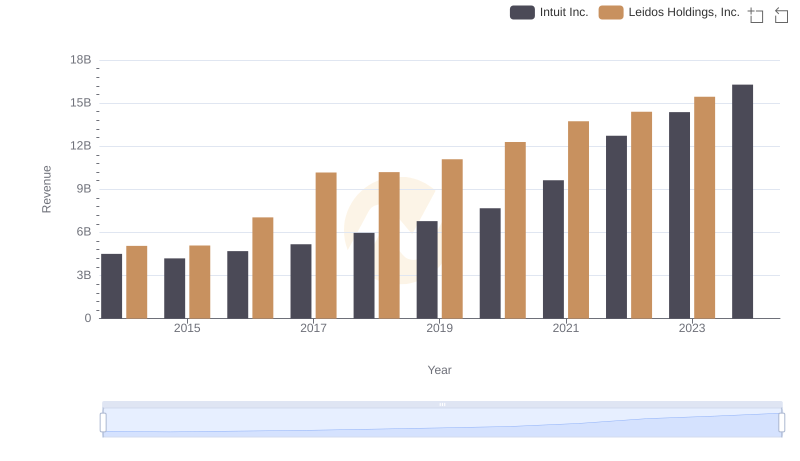
Intuit Inc. vs Leidos Holdings, Inc.: Examining Key Revenue Metrics

Cost of Revenue Comparison: Intuit Inc. vs Teradyne, Inc.
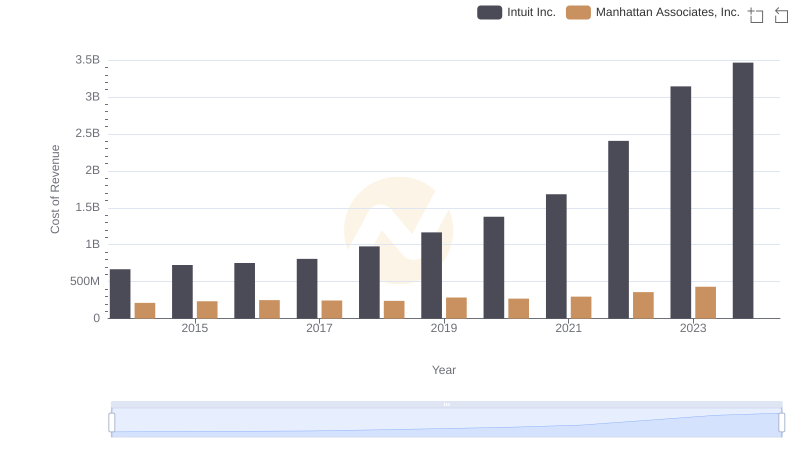
Analyzing Cost of Revenue: Intuit Inc. and Manhattan Associates, Inc.
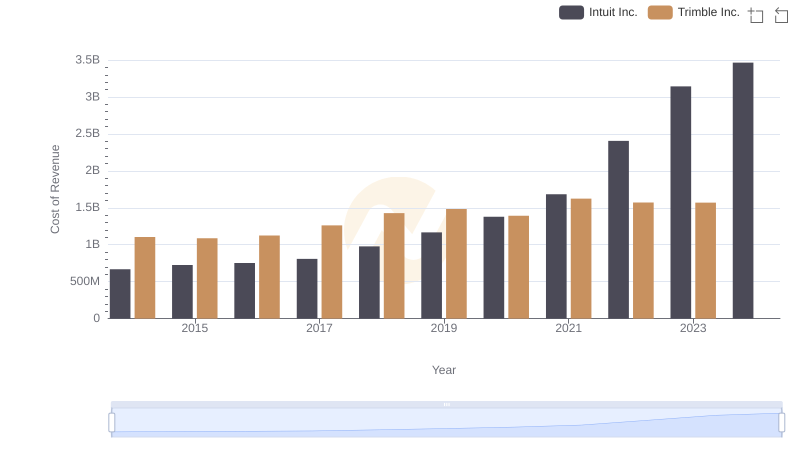
Comparing Cost of Revenue Efficiency: Intuit Inc. vs Trimble Inc.
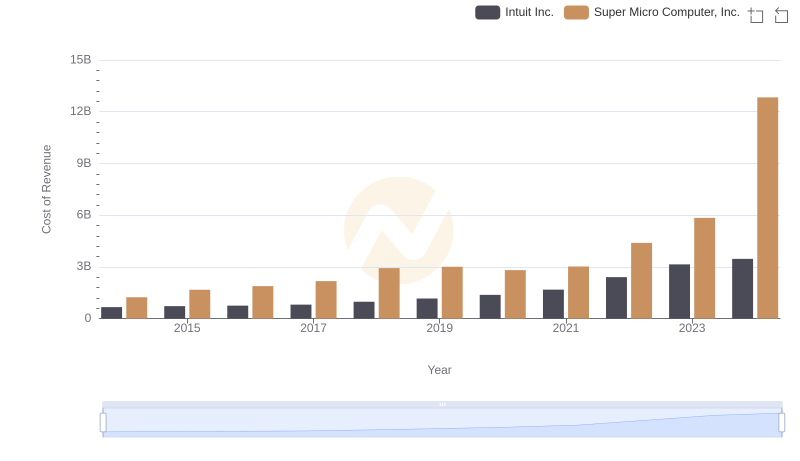
Cost of Revenue: Key Insights for Intuit Inc. and Super Micro Computer, Inc.
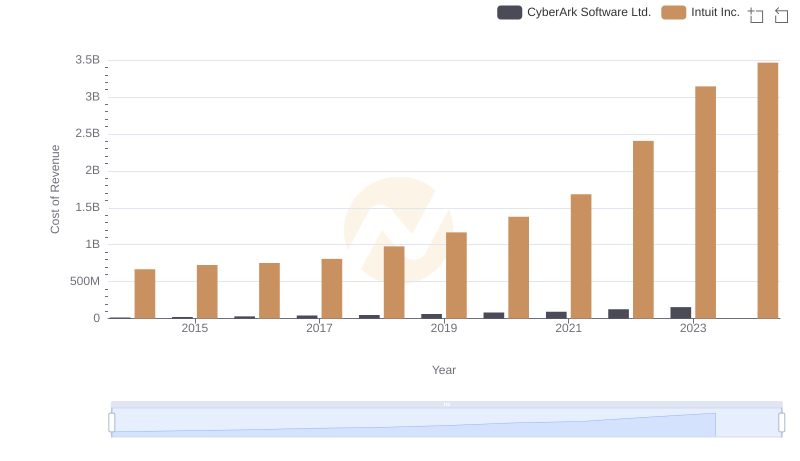
Cost of Revenue Trends: Intuit Inc. vs CyberArk Software Ltd.
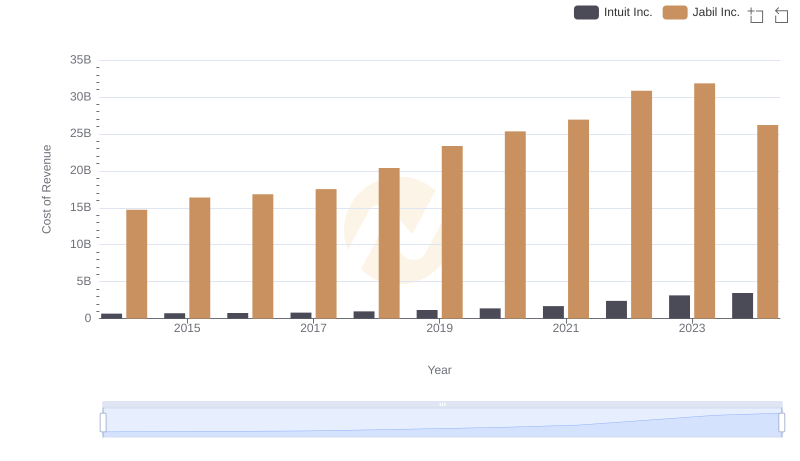
Cost Insights: Breaking Down Intuit Inc. and Jabil Inc.'s Expenses
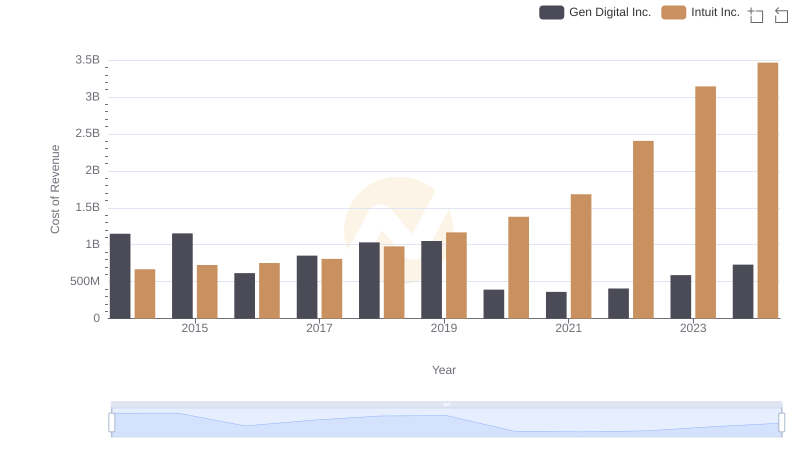
Comparing Cost of Revenue Efficiency: Intuit Inc. vs Gen Digital Inc.
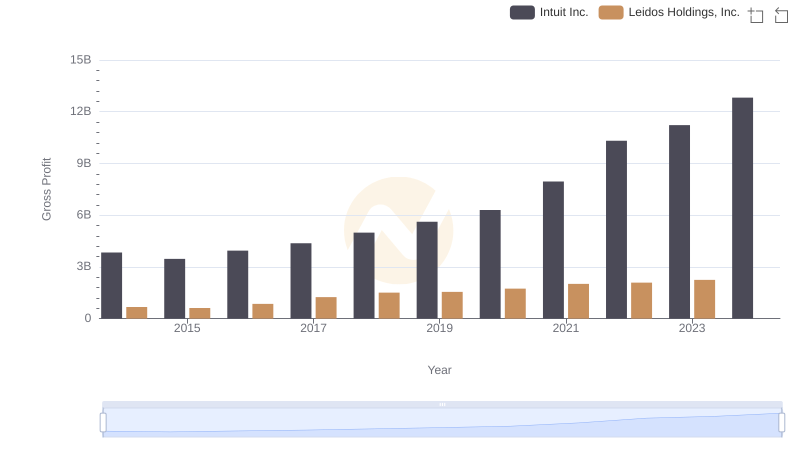
Intuit Inc. and Leidos Holdings, Inc.: A Detailed Gross Profit Analysis
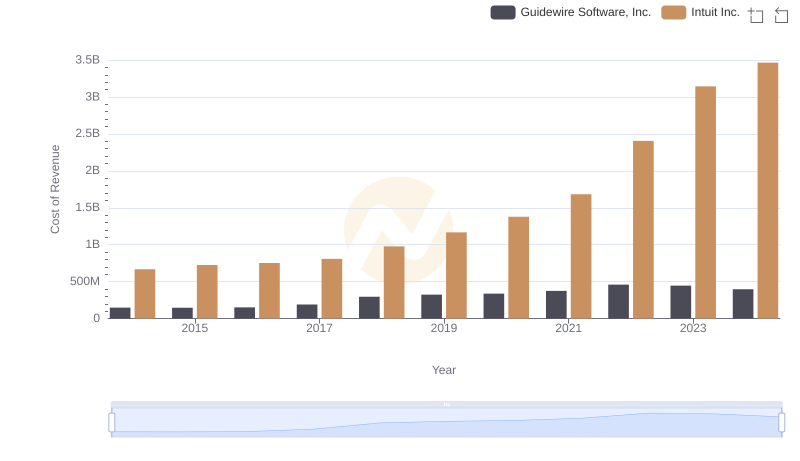
Analyzing Cost of Revenue: Intuit Inc. and Guidewire Software, Inc.
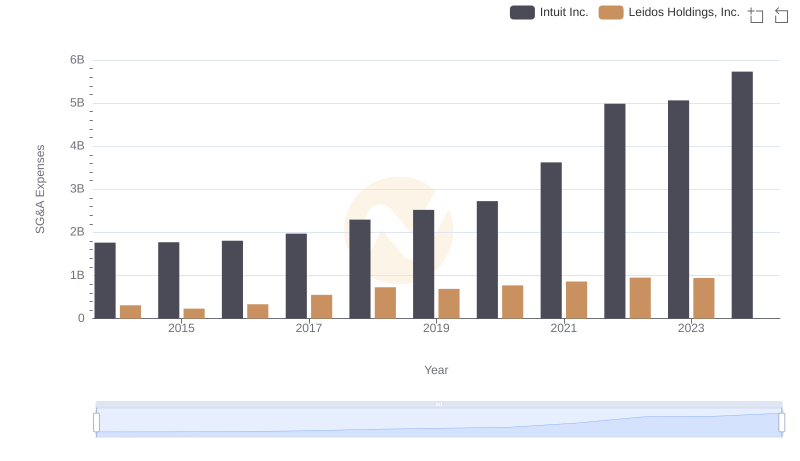
Operational Costs Compared: SG&A Analysis of Intuit Inc. and Leidos Holdings, Inc.