| __timestamp | Intuit Inc. | KLA Corporation |
|---|---|---|
| Wednesday, January 1, 2014 | 668000000 | 1232962000 |
| Thursday, January 1, 2015 | 725000000 | 1215229000 |
| Friday, January 1, 2016 | 752000000 | 1163391000 |
| Sunday, January 1, 2017 | 809000000 | 1287547000 |
| Monday, January 1, 2018 | 977000000 | 1447369000 |
| Tuesday, January 1, 2019 | 1167000000 | 1869377000 |
| Wednesday, January 1, 2020 | 1378000000 | 2449561000 |
| Friday, January 1, 2021 | 1683000000 | 2772165000 |
| Saturday, January 1, 2022 | 2406000000 | 3592441000 |
| Sunday, January 1, 2023 | 3143000000 | 4218307000 |
| Monday, January 1, 2024 | 3465000000 | 3928073000 |
In pursuit of knowledge
In the ever-evolving landscape of technology, Intuit Inc. and KLA Corporation have emerged as titans, each carving a unique path in their respective domains. Over the past decade, from 2014 to 2024, these companies have demonstrated remarkable growth in their cost of revenue, a key indicator of operational scale and efficiency.
Intuit Inc., renowned for its financial software, has seen its cost of revenue soar by over 400%, from approximately $680 million in 2014 to an impressive $3.47 billion in 2024. This growth reflects Intuit's expanding market reach and investment in cutting-edge technology.
Meanwhile, KLA Corporation, a leader in semiconductor manufacturing, has experienced a 220% increase, peaking at $4.22 billion in 2023. This surge underscores KLA's pivotal role in the semiconductor industry, driven by global demand for advanced chips.
As these giants continue to innovate, their cost of revenue trends offer a glimpse into the future of technology.
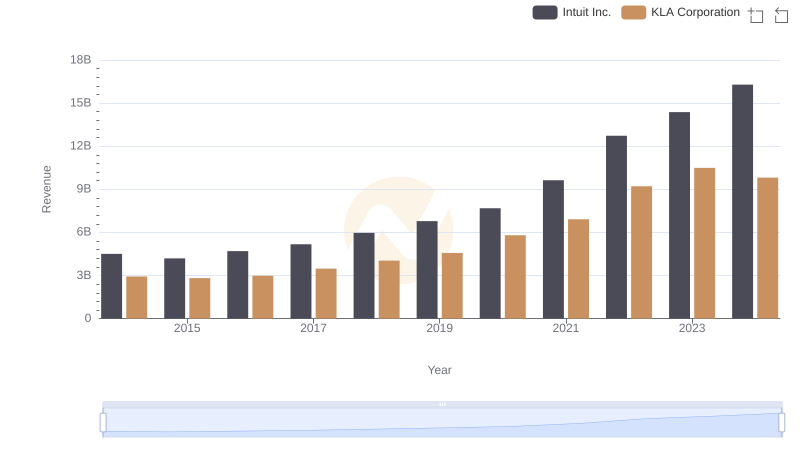
Revenue Showdown: Intuit Inc. vs KLA Corporation
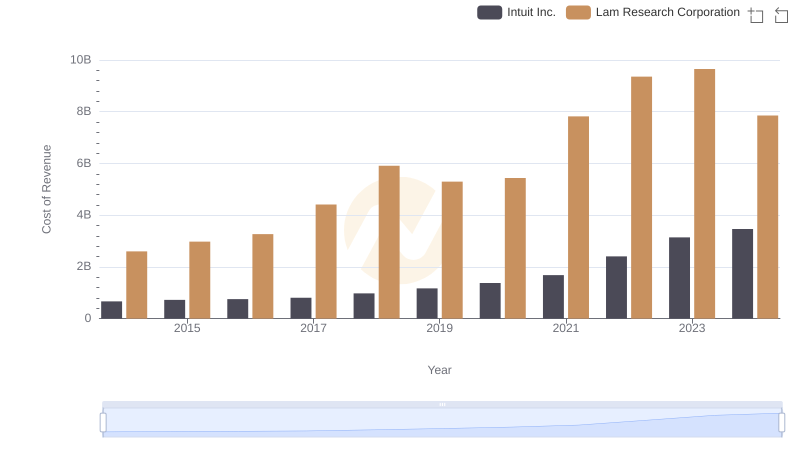
Analyzing Cost of Revenue: Intuit Inc. and Lam Research Corporation
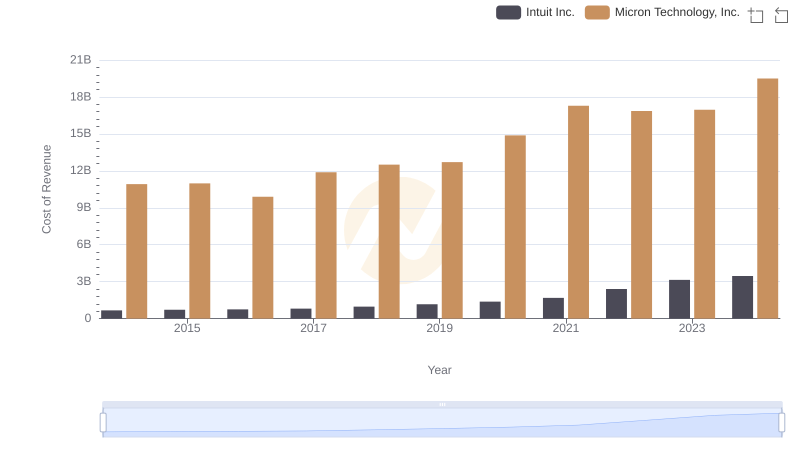
Cost of Revenue Trends: Intuit Inc. vs Micron Technology, Inc.
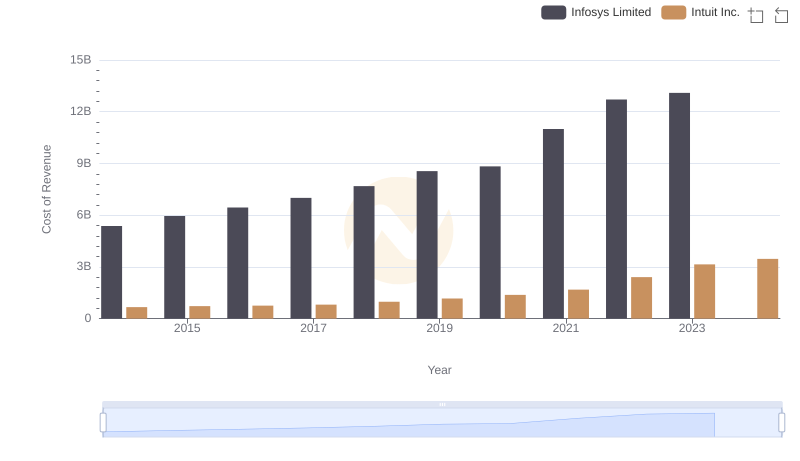
Comparing Cost of Revenue Efficiency: Intuit Inc. vs Infosys Limited
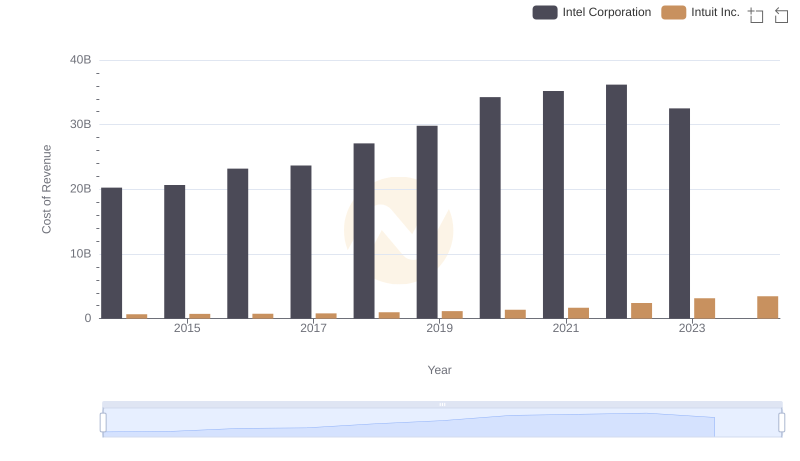
Intuit Inc. vs Intel Corporation: Efficiency in Cost of Revenue Explored
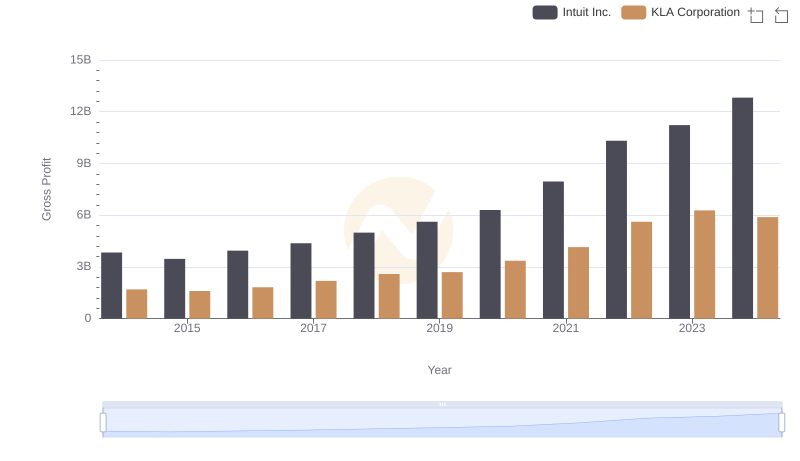
Intuit Inc. and KLA Corporation: A Detailed Gross Profit Analysis
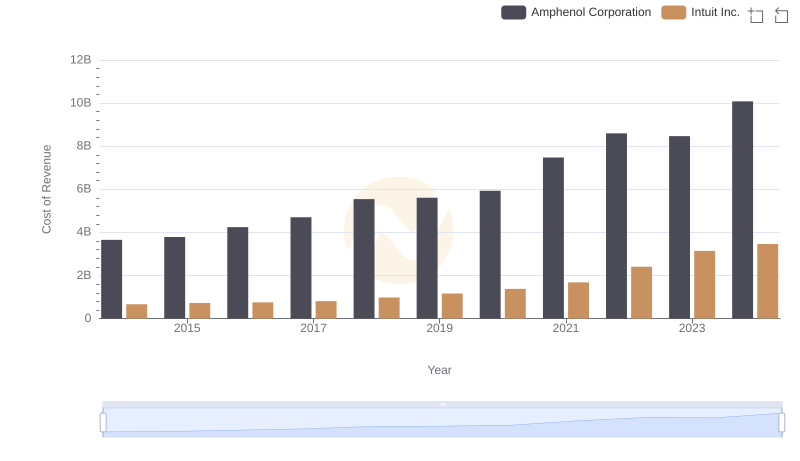
Analyzing Cost of Revenue: Intuit Inc. and Amphenol Corporation
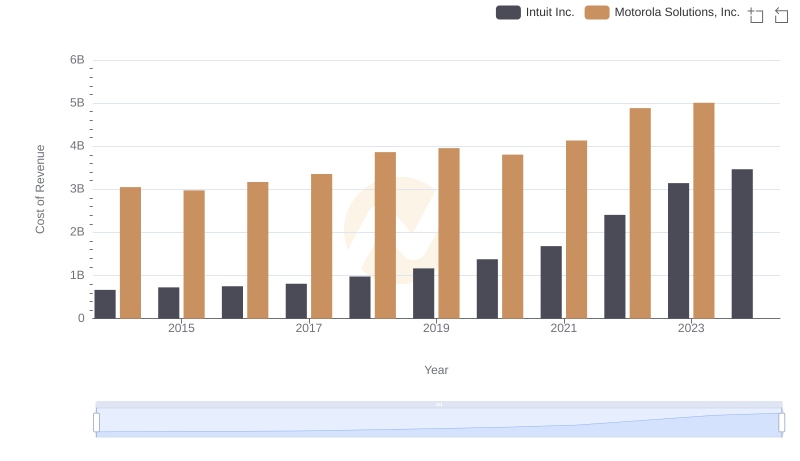
Cost Insights: Breaking Down Intuit Inc. and Motorola Solutions, Inc.'s Expenses
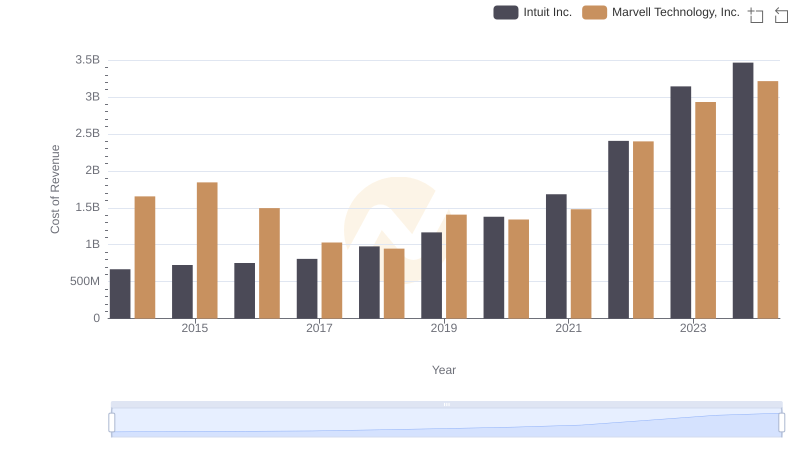
Cost of Revenue Comparison: Intuit Inc. vs Marvell Technology, Inc.
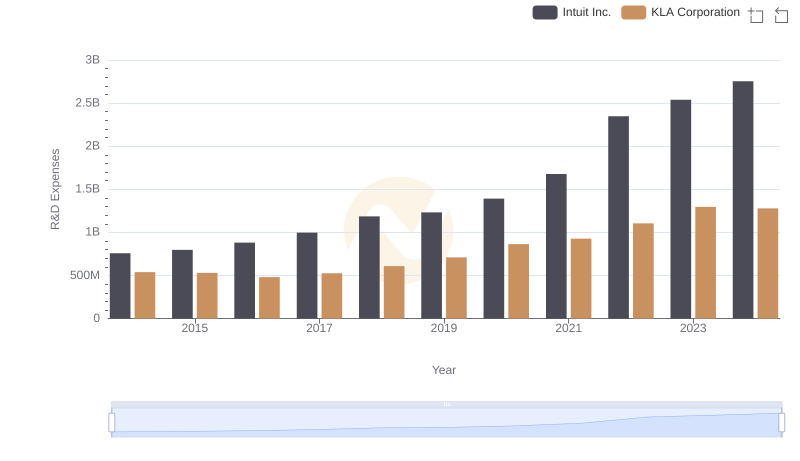
Research and Development: Comparing Key Metrics for Intuit Inc. and KLA Corporation
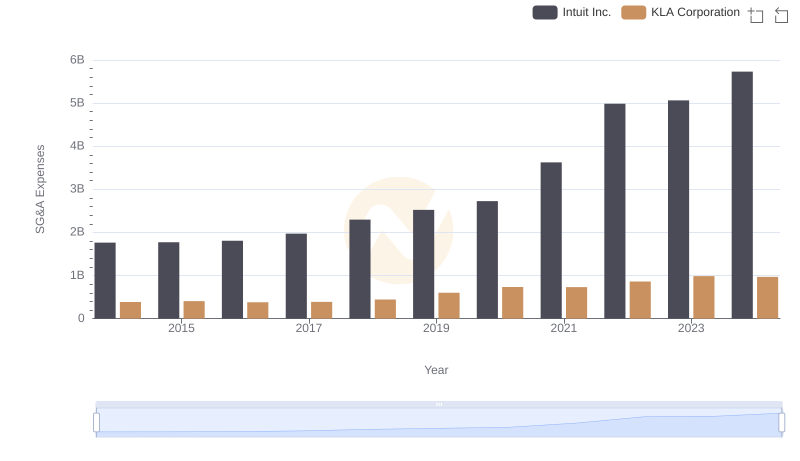
Intuit Inc. and KLA Corporation: SG&A Spending Patterns Compared
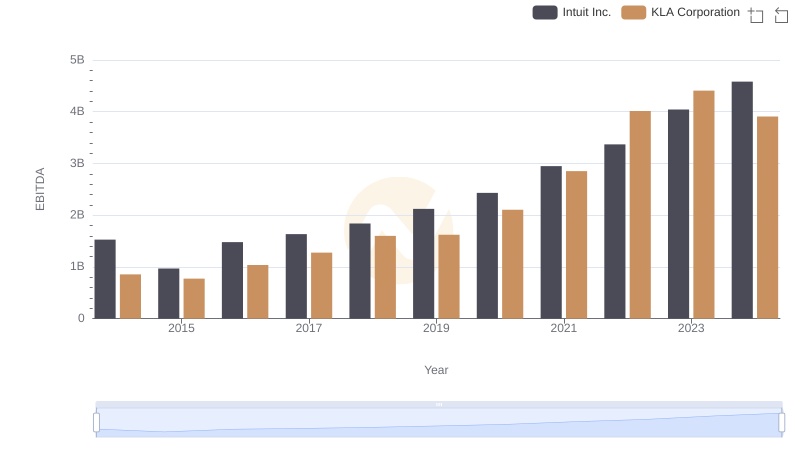
Intuit Inc. vs KLA Corporation: In-Depth EBITDA Performance Comparison