| __timestamp | Ingersoll Rand Inc. | Nordson Corporation |
|---|---|---|
| Wednesday, January 1, 2014 | 1633224000 | 758923000 |
| Thursday, January 1, 2015 | 1347800000 | 774702000 |
| Friday, January 1, 2016 | 1222705000 | 815495000 |
| Sunday, January 1, 2017 | 1477500000 | 927981000 |
| Monday, January 1, 2018 | 1677300000 | 1018703000 |
| Tuesday, January 1, 2019 | 1540200000 | 1002123000 |
| Wednesday, January 1, 2020 | 3296800000 | 990632000 |
| Friday, January 1, 2021 | 3163900000 | 1038129000 |
| Saturday, January 1, 2022 | 3590700000 | 1163742000 |
| Sunday, January 1, 2023 | 3993900000 | 1203227000 |
| Monday, January 1, 2024 | 0 | 1203792000 |
In pursuit of knowledge
In the competitive landscape of industrial manufacturing, Ingersoll Rand Inc. and Nordson Corporation have been pivotal players. Over the past decade, from 2014 to 2023, these companies have showcased distinct trajectories in their cost of revenue. Ingersoll Rand Inc. experienced a significant surge, with costs nearly doubling from 2014 to 2023, peaking at approximately $4 billion in 2023. This represents a staggering 145% increase over the period. In contrast, Nordson Corporation maintained a more stable growth, with costs rising by about 58% to reach $1.2 billion in 2023. Notably, 2020 marked a pivotal year for Ingersoll Rand, with costs jumping by over 110% compared to the previous year. This data highlights the dynamic strategies and market conditions influencing these industrial titans. However, the absence of data for Ingersoll Rand in 2024 leaves room for speculation on future trends.
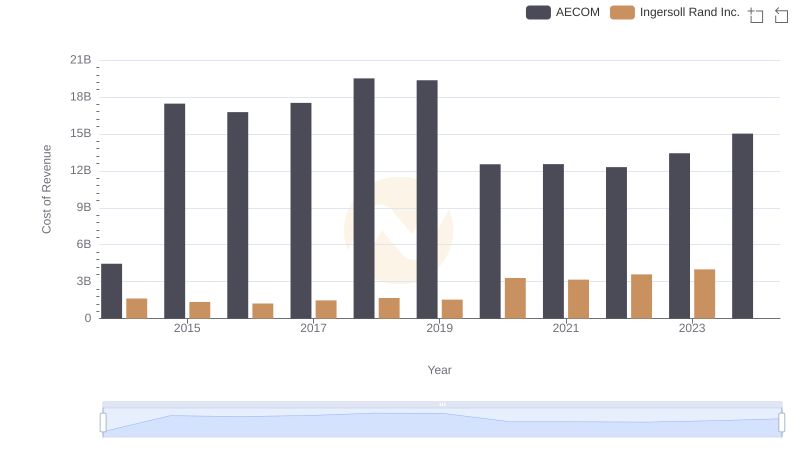
Cost Insights: Breaking Down Ingersoll Rand Inc. and AECOM's Expenses
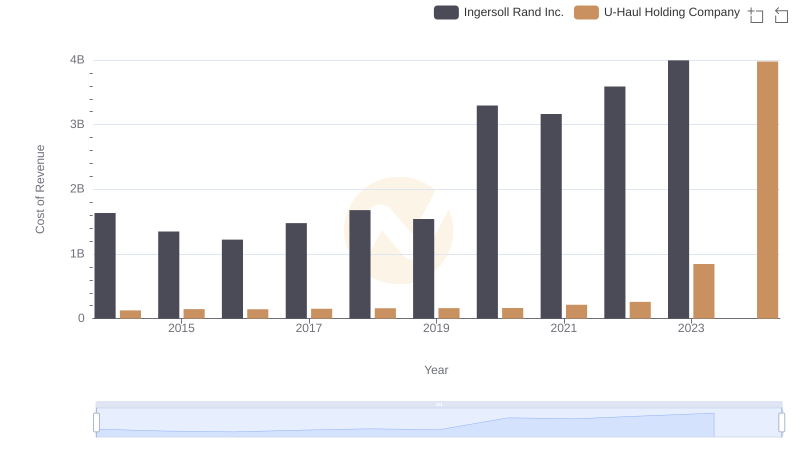
Ingersoll Rand Inc. vs U-Haul Holding Company: Efficiency in Cost of Revenue Explored
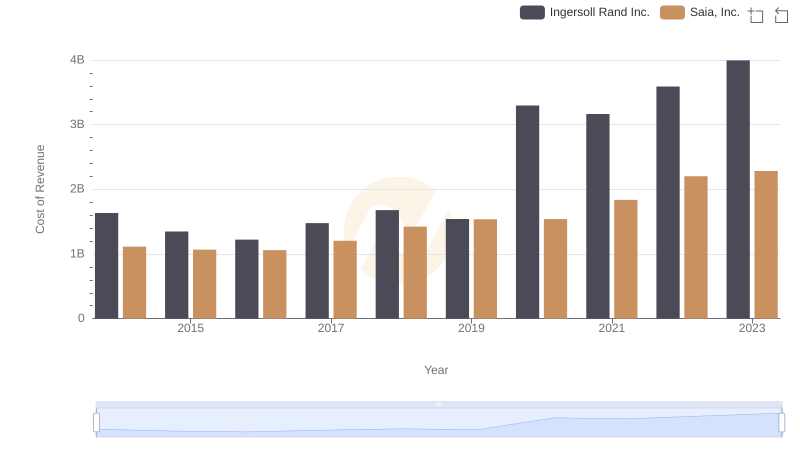
Cost of Revenue: Key Insights for Ingersoll Rand Inc. and Saia, Inc.
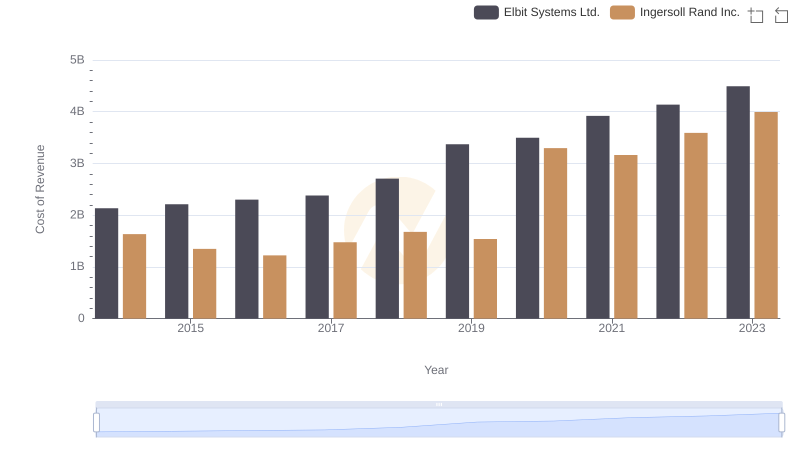
Cost of Revenue Trends: Ingersoll Rand Inc. vs Elbit Systems Ltd.
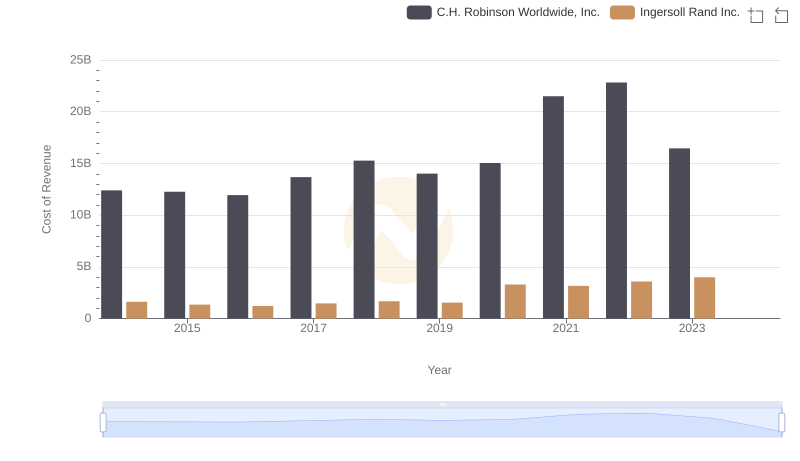
Cost Insights: Breaking Down Ingersoll Rand Inc. and C.H. Robinson Worldwide, Inc.'s Expenses
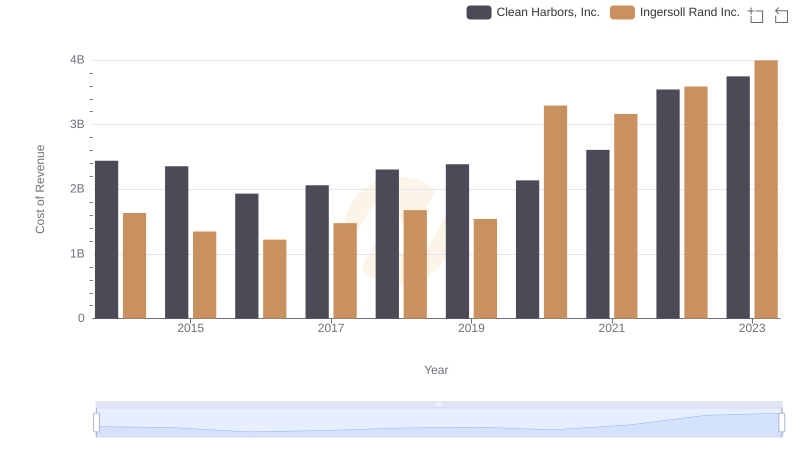
Cost of Revenue: Key Insights for Ingersoll Rand Inc. and Clean Harbors, Inc.
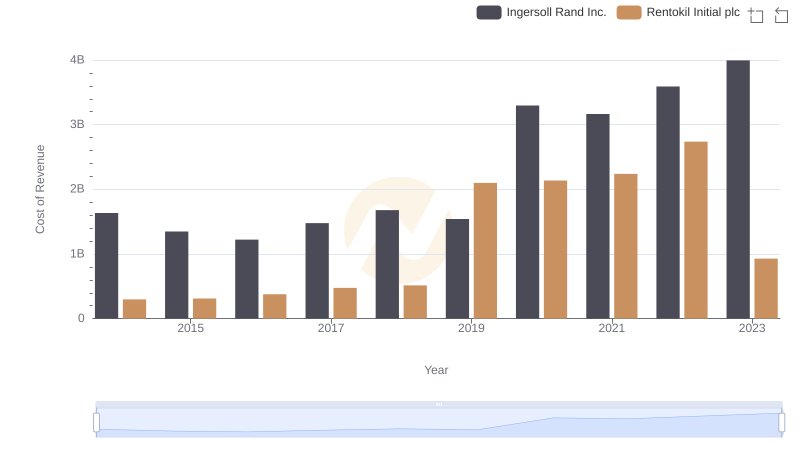
Cost of Revenue Comparison: Ingersoll Rand Inc. vs Rentokil Initial plc
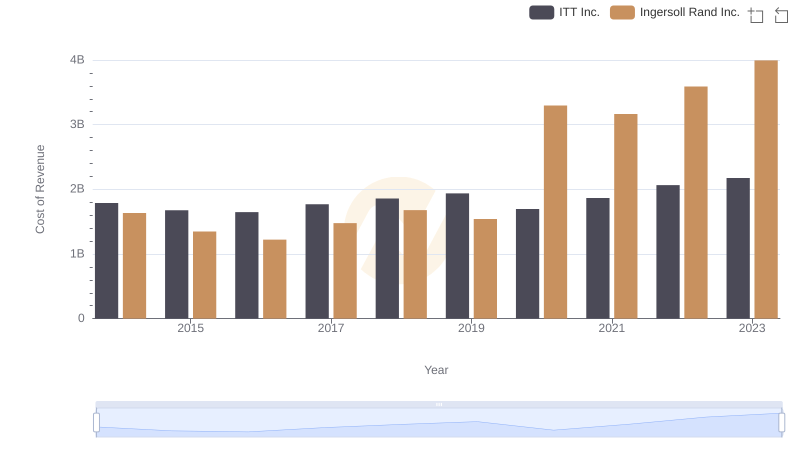
Ingersoll Rand Inc. vs ITT Inc.: Efficiency in Cost of Revenue Explored
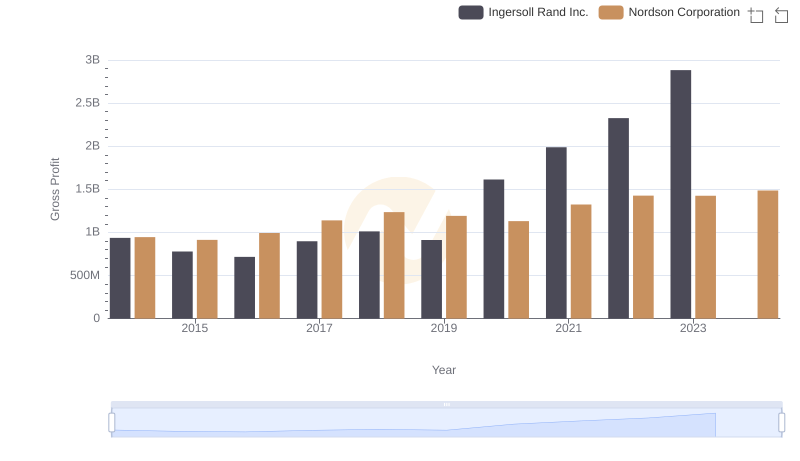
Ingersoll Rand Inc. vs Nordson Corporation: A Gross Profit Performance Breakdown
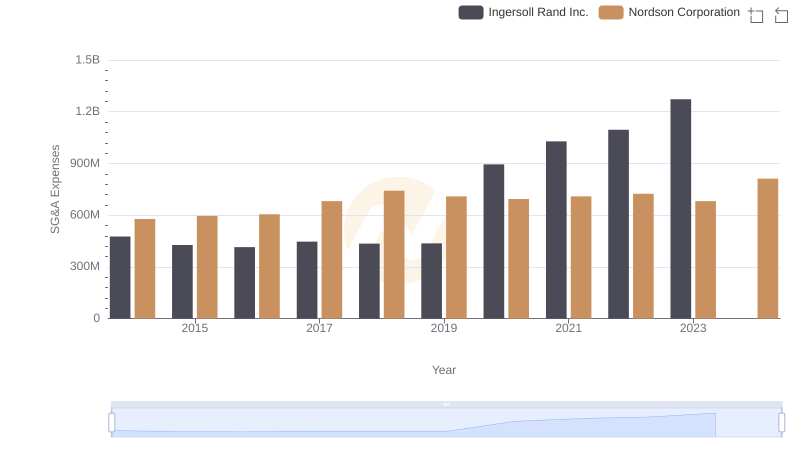
Breaking Down SG&A Expenses: Ingersoll Rand Inc. vs Nordson Corporation