| __timestamp | Ingersoll Rand Inc. | Nordson Corporation |
|---|---|---|
| Wednesday, January 1, 2014 | 936781000 | 945098000 |
| Thursday, January 1, 2015 | 779100000 | 913964000 |
| Friday, January 1, 2016 | 716731000 | 993499000 |
| Sunday, January 1, 2017 | 897900000 | 1139001000 |
| Monday, January 1, 2018 | 1012500000 | 1235965000 |
| Tuesday, January 1, 2019 | 911700000 | 1192103000 |
| Wednesday, January 1, 2020 | 1613400000 | 1130468000 |
| Friday, January 1, 2021 | 1988500000 | 1324080000 |
| Saturday, January 1, 2022 | 2325600000 | 1426536000 |
| Sunday, January 1, 2023 | 2882200000 | 1425405000 |
| Monday, January 1, 2024 | 0 | 1486129000 |
Unleashing the power of data
In the competitive landscape of industrial manufacturing, Ingersoll Rand Inc. and Nordson Corporation have showcased intriguing trends in gross profit over the past decade. From 2014 to 2023, Ingersoll Rand's gross profit surged by approximately 207%, peaking in 2023. This remarkable growth reflects strategic expansions and operational efficiencies. In contrast, Nordson Corporation exhibited a steady increase of about 51% during the same period, highlighting its consistent market presence and innovation-driven growth.
The data for 2024 is incomplete, but Nordson's continued upward trend suggests a promising future. This analysis underscores the dynamic nature of the industrial sector and the importance of strategic growth initiatives.
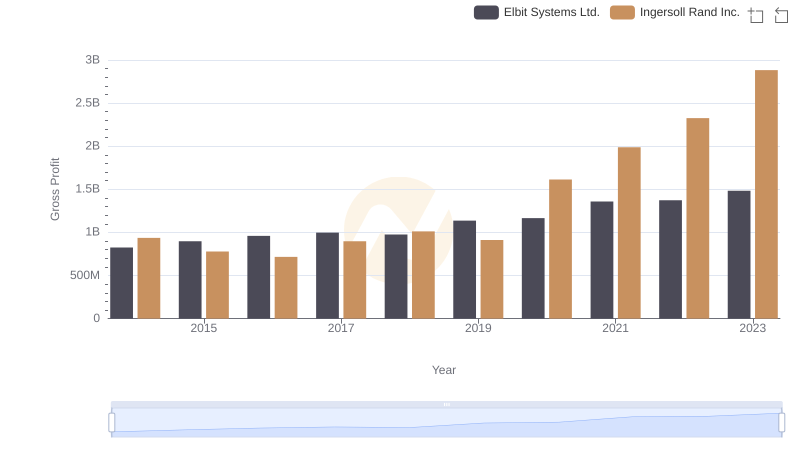
Gross Profit Analysis: Comparing Ingersoll Rand Inc. and Elbit Systems Ltd.
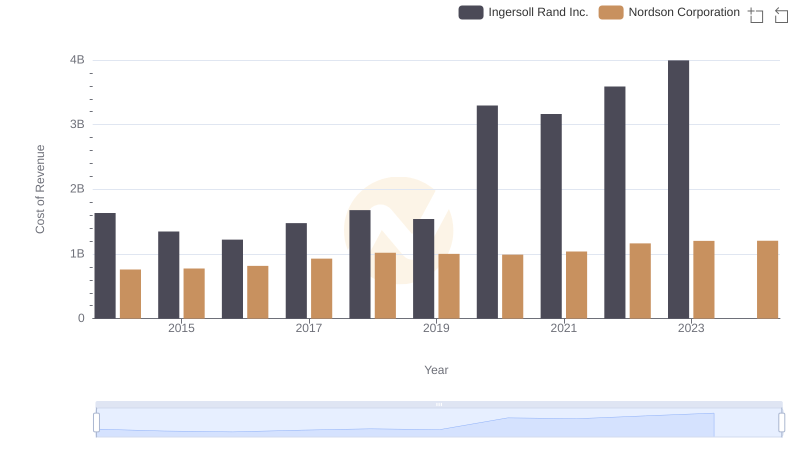
Cost of Revenue Comparison: Ingersoll Rand Inc. vs Nordson Corporation
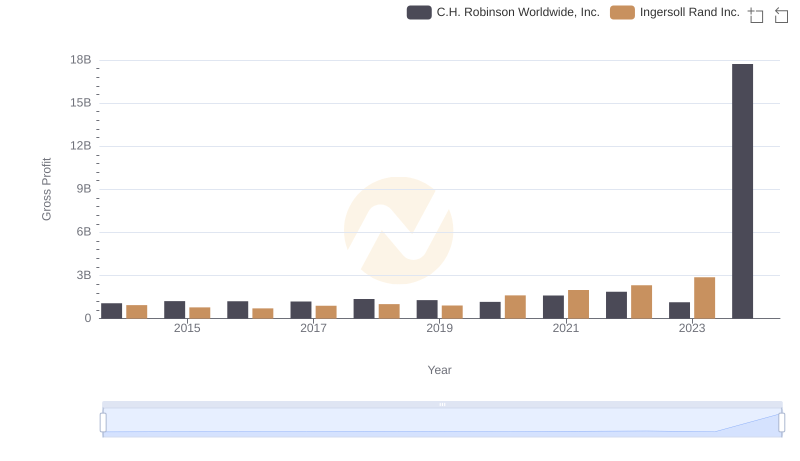
Ingersoll Rand Inc. and C.H. Robinson Worldwide, Inc.: A Detailed Gross Profit Analysis
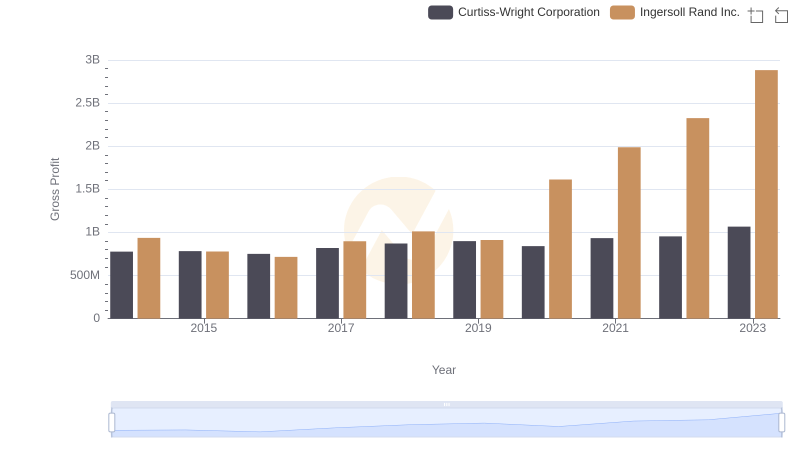
Who Generates Higher Gross Profit? Ingersoll Rand Inc. or Curtiss-Wright Corporation
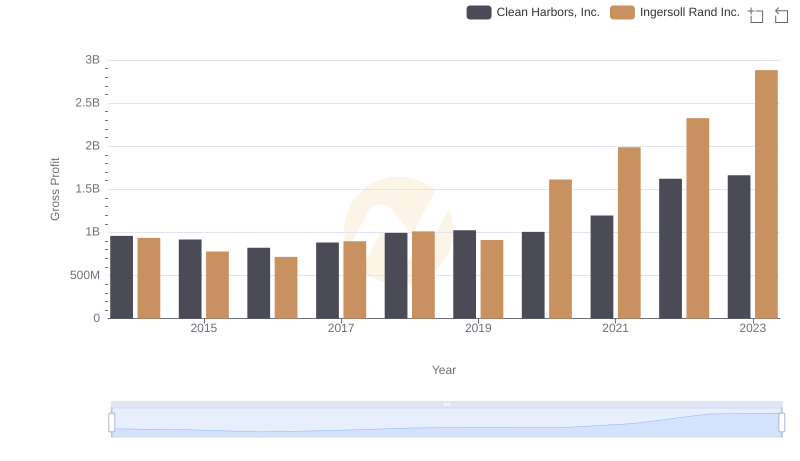
Who Generates Higher Gross Profit? Ingersoll Rand Inc. or Clean Harbors, Inc.
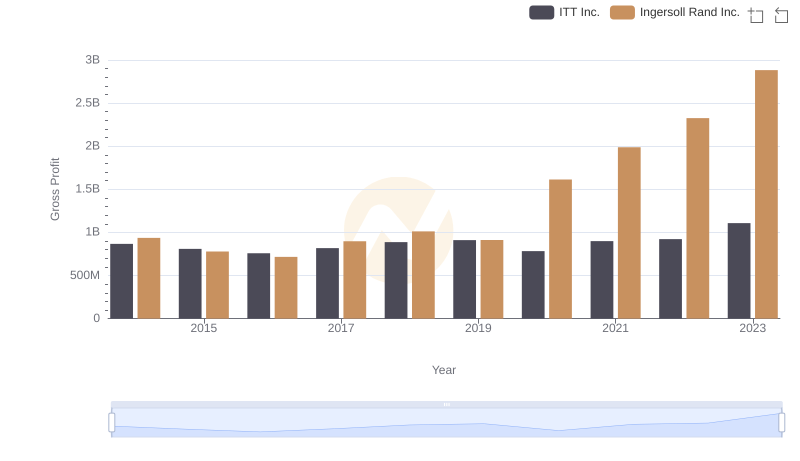
Gross Profit Comparison: Ingersoll Rand Inc. and ITT Inc. Trends
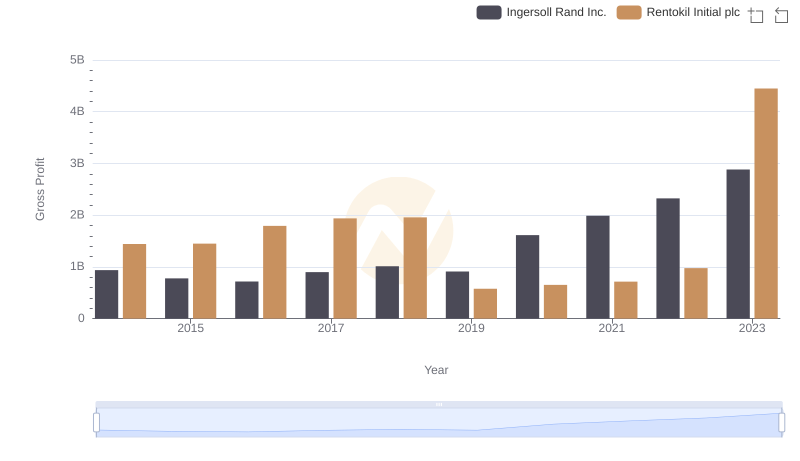
Gross Profit Comparison: Ingersoll Rand Inc. and Rentokil Initial plc Trends
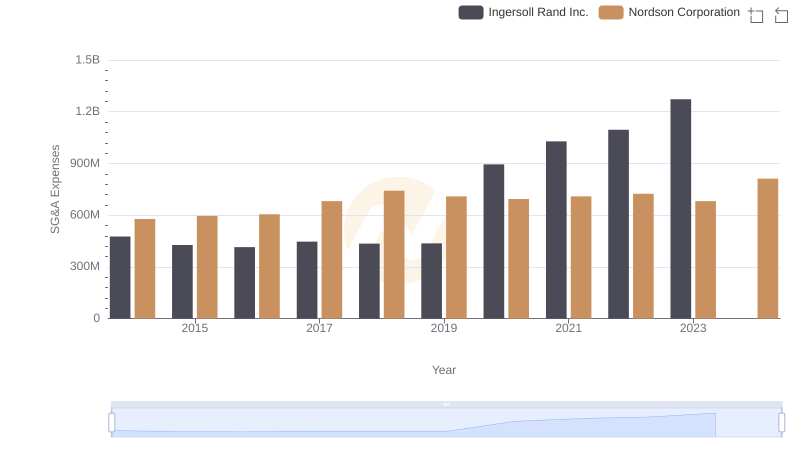
Breaking Down SG&A Expenses: Ingersoll Rand Inc. vs Nordson Corporation