| __timestamp | C.H. Robinson Worldwide, Inc. | Ingersoll Rand Inc. |
|---|---|---|
| Wednesday, January 1, 2014 | 12401436000 | 1633224000 |
| Thursday, January 1, 2015 | 12259014000 | 1347800000 |
| Friday, January 1, 2016 | 11931821000 | 1222705000 |
| Sunday, January 1, 2017 | 13680857000 | 1477500000 |
| Monday, January 1, 2018 | 15269479000 | 1677300000 |
| Tuesday, January 1, 2019 | 14021726000 | 1540200000 |
| Wednesday, January 1, 2020 | 15037716000 | 3296800000 |
| Friday, January 1, 2021 | 21493659000 | 3163900000 |
| Saturday, January 1, 2022 | 22826428000 | 3590700000 |
| Sunday, January 1, 2023 | 16457570000 | 3993900000 |
| Monday, January 1, 2024 | 16416191000 | 0 |
Data in motion
In the ever-evolving landscape of industrial and logistics sectors, understanding cost structures is pivotal. From 2014 to 2023, C.H. Robinson Worldwide, Inc. consistently demonstrated a robust cost of revenue, peaking in 2022 with a 64% increase from 2014. Ingersoll Rand Inc., on the other hand, showcased a steady growth trajectory, with its cost of revenue nearly doubling by 2023 compared to 2014. This trend highlights the resilience and adaptability of these companies amidst economic fluctuations. Notably, 2020 marked a significant surge for Ingersoll Rand, with a 114% increase from the previous year, reflecting strategic shifts in operations. As we delve into these insights, it's clear that both companies are navigating their financial landscapes with distinct strategies, offering a fascinating glimpse into their operational efficiencies.
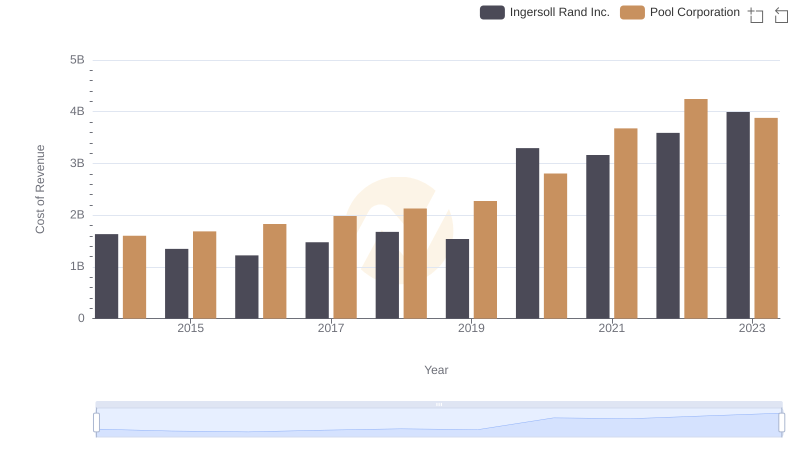
Cost Insights: Breaking Down Ingersoll Rand Inc. and Pool Corporation's Expenses
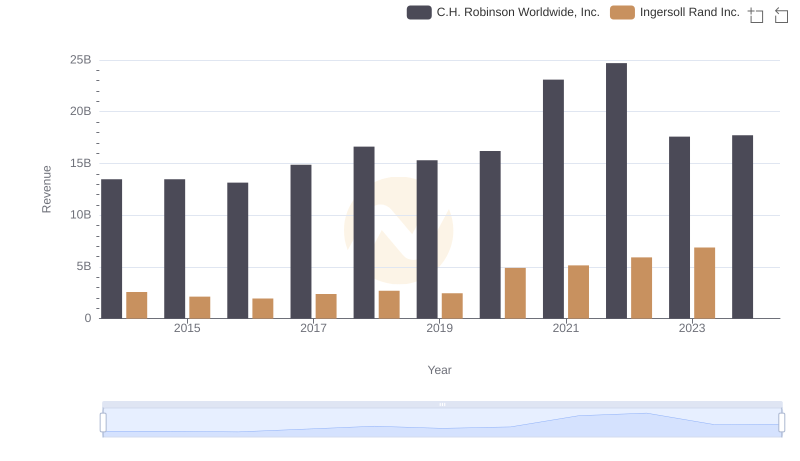
Comparing Revenue Performance: Ingersoll Rand Inc. or C.H. Robinson Worldwide, Inc.?
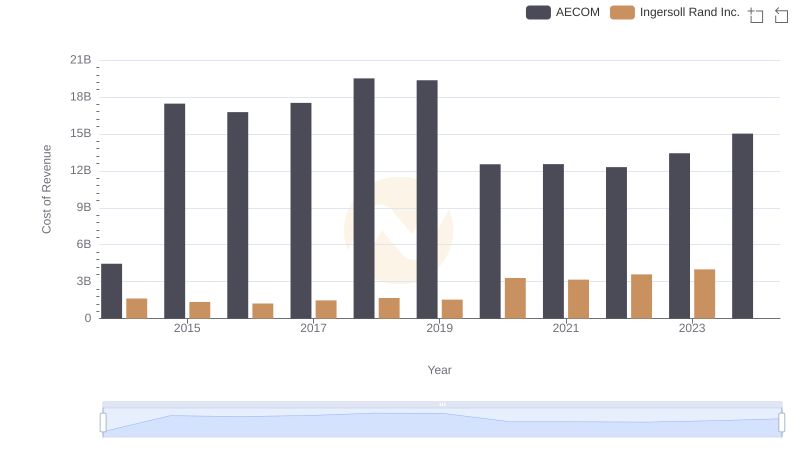
Cost Insights: Breaking Down Ingersoll Rand Inc. and AECOM's Expenses
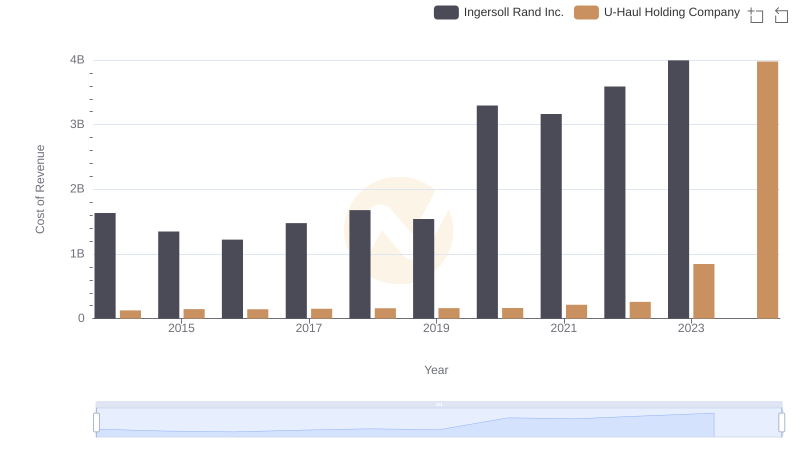
Ingersoll Rand Inc. vs U-Haul Holding Company: Efficiency in Cost of Revenue Explored
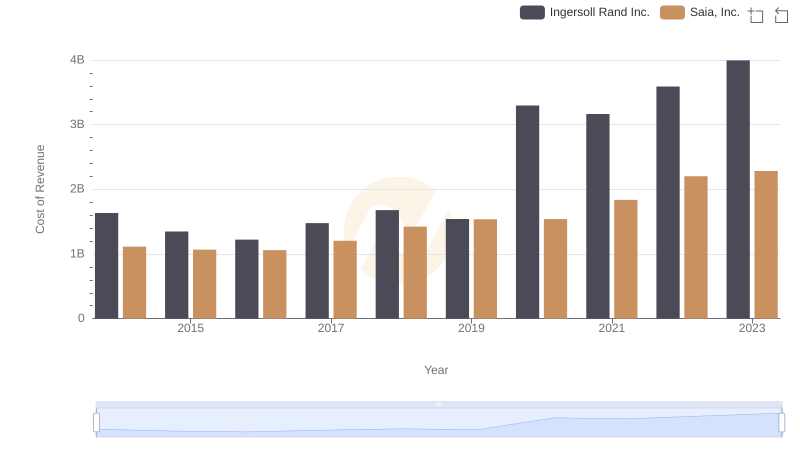
Cost of Revenue: Key Insights for Ingersoll Rand Inc. and Saia, Inc.
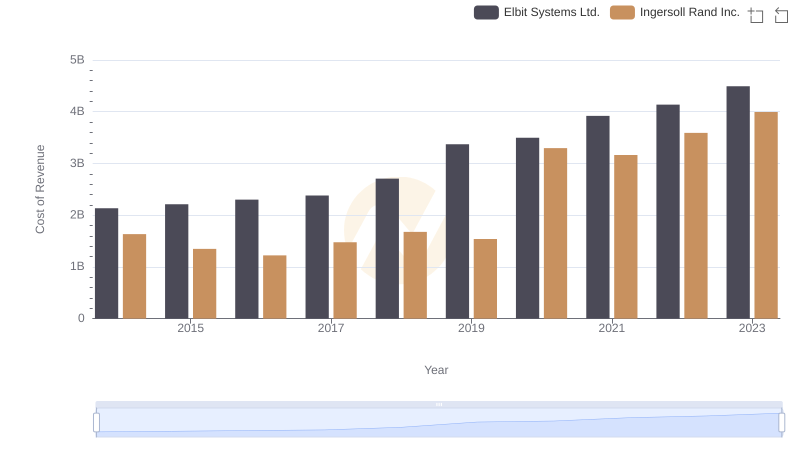
Cost of Revenue Trends: Ingersoll Rand Inc. vs Elbit Systems Ltd.
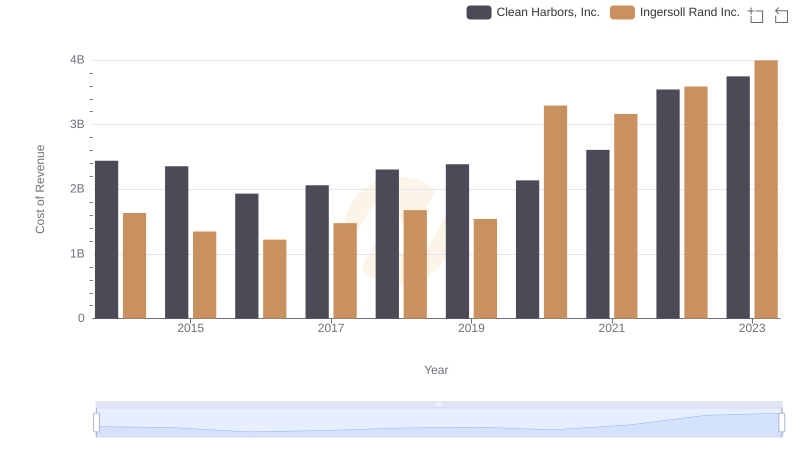
Cost of Revenue: Key Insights for Ingersoll Rand Inc. and Clean Harbors, Inc.
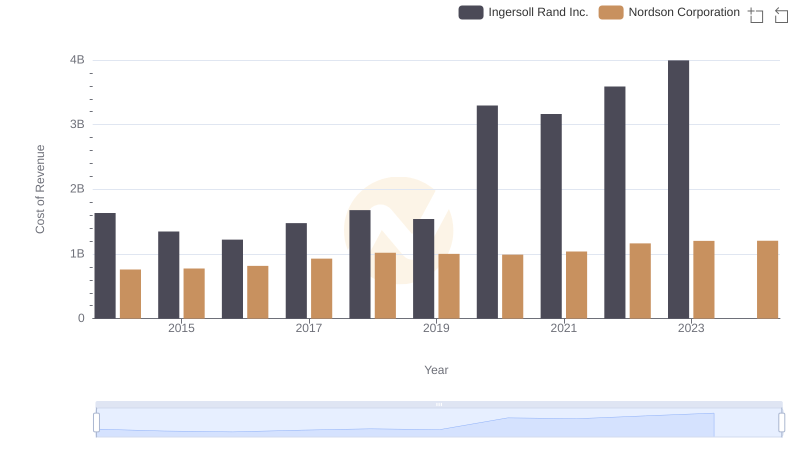
Cost of Revenue Comparison: Ingersoll Rand Inc. vs Nordson Corporation
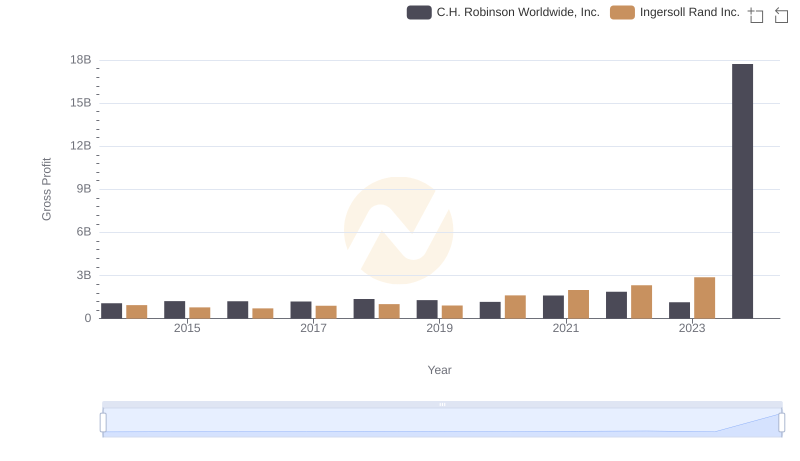
Ingersoll Rand Inc. and C.H. Robinson Worldwide, Inc.: A Detailed Gross Profit Analysis
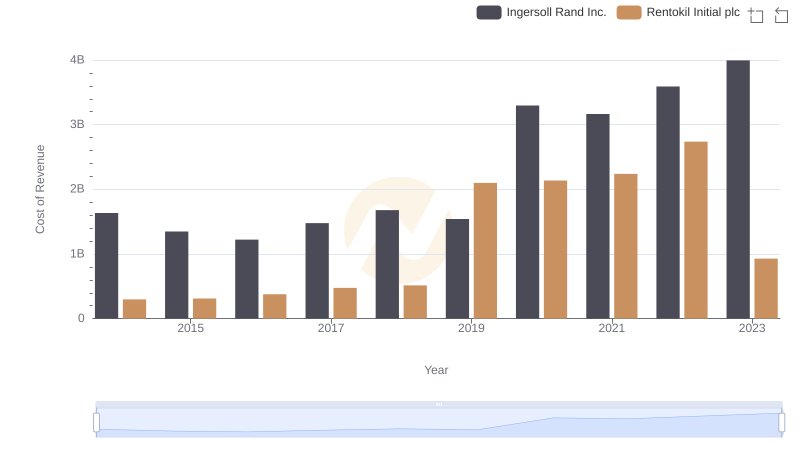
Cost of Revenue Comparison: Ingersoll Rand Inc. vs Rentokil Initial plc
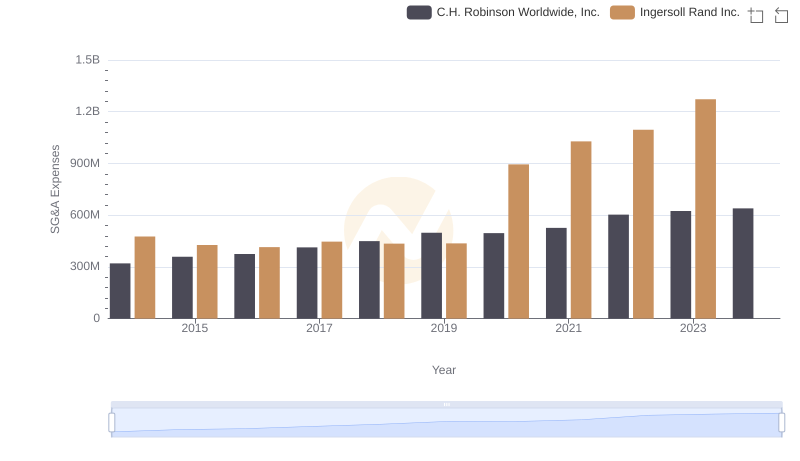
Breaking Down SG&A Expenses: Ingersoll Rand Inc. vs C.H. Robinson Worldwide, Inc.