| __timestamp | Ingersoll Rand Inc. | Nordson Corporation |
|---|---|---|
| Wednesday, January 1, 2014 | 476000000 | 577993000 |
| Thursday, January 1, 2015 | 427000000 | 596234000 |
| Friday, January 1, 2016 | 414339000 | 605068000 |
| Sunday, January 1, 2017 | 446600000 | 681299000 |
| Monday, January 1, 2018 | 434600000 | 741408000 |
| Tuesday, January 1, 2019 | 436400000 | 708990000 |
| Wednesday, January 1, 2020 | 894800000 | 693552000 |
| Friday, January 1, 2021 | 1028000000 | 708953000 |
| Saturday, January 1, 2022 | 1095800000 | 724176000 |
| Sunday, January 1, 2023 | 1272700000 | 681244000 |
| Monday, January 1, 2024 | 0 | 812128000 |
Unlocking the unknown
In the ever-evolving landscape of industrial manufacturing, understanding the financial health of companies is crucial. This analysis delves into the Selling, General, and Administrative (SG&A) expenses of two industry giants: Ingersoll Rand Inc. and Nordson Corporation, from 2014 to 2023.
Ingersoll Rand Inc. has seen a remarkable increase in SG&A expenses, growing by approximately 167% over the decade. This surge, particularly notable from 2020 onwards, reflects strategic investments and potential expansions. In contrast, Nordson Corporation's SG&A expenses have remained relatively stable, with a modest increase of around 40% over the same period.
The data highlights a pivotal moment in 2020 when Ingersoll Rand's expenses nearly doubled, surpassing Nordson's for the first time. This shift underscores the dynamic strategies employed by these companies in response to market demands and economic conditions.
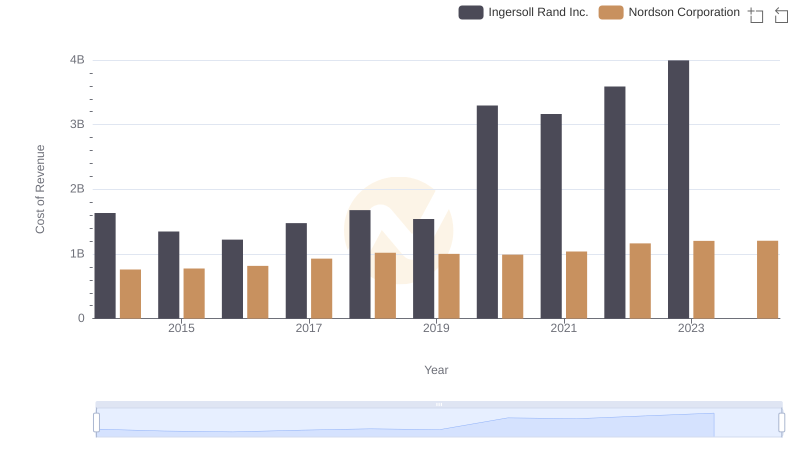
Cost of Revenue Comparison: Ingersoll Rand Inc. vs Nordson Corporation
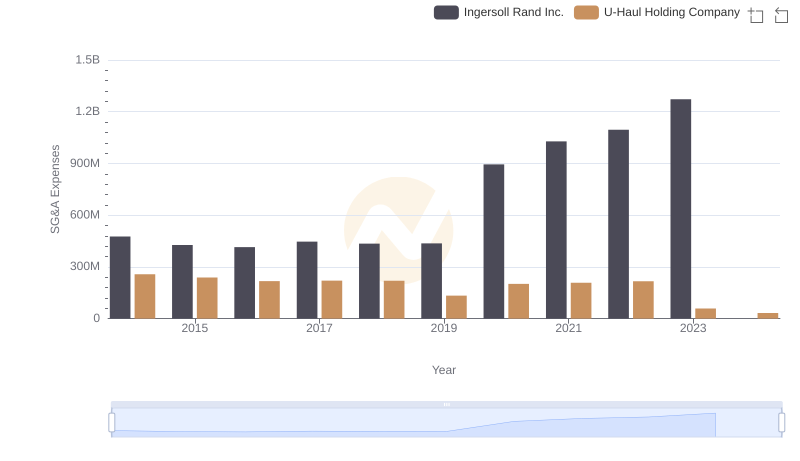
SG&A Efficiency Analysis: Comparing Ingersoll Rand Inc. and U-Haul Holding Company
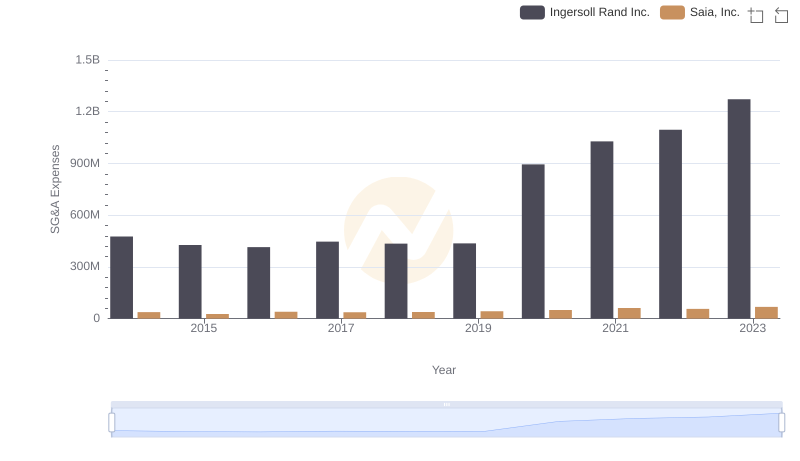
SG&A Efficiency Analysis: Comparing Ingersoll Rand Inc. and Saia, Inc.
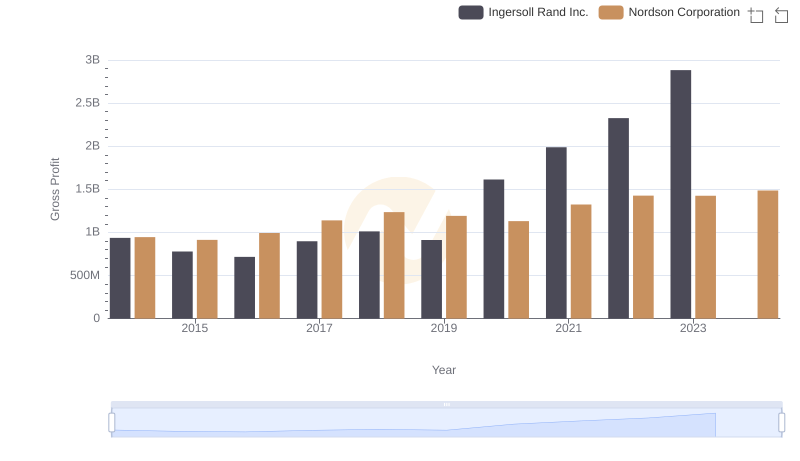
Ingersoll Rand Inc. vs Nordson Corporation: A Gross Profit Performance Breakdown
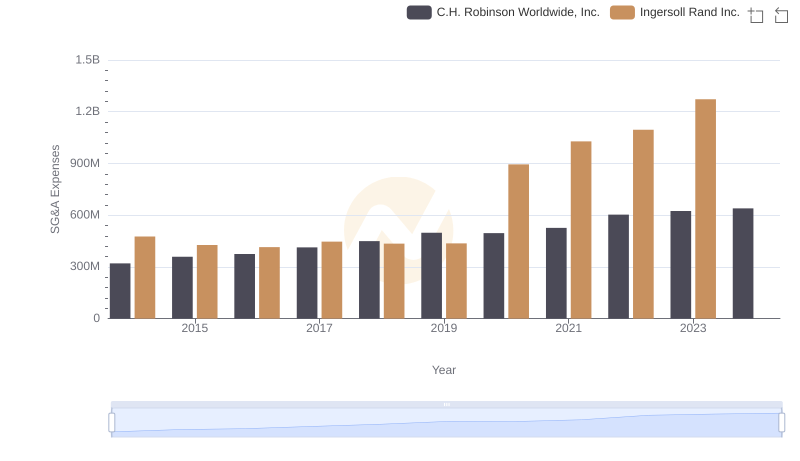
Breaking Down SG&A Expenses: Ingersoll Rand Inc. vs C.H. Robinson Worldwide, Inc.
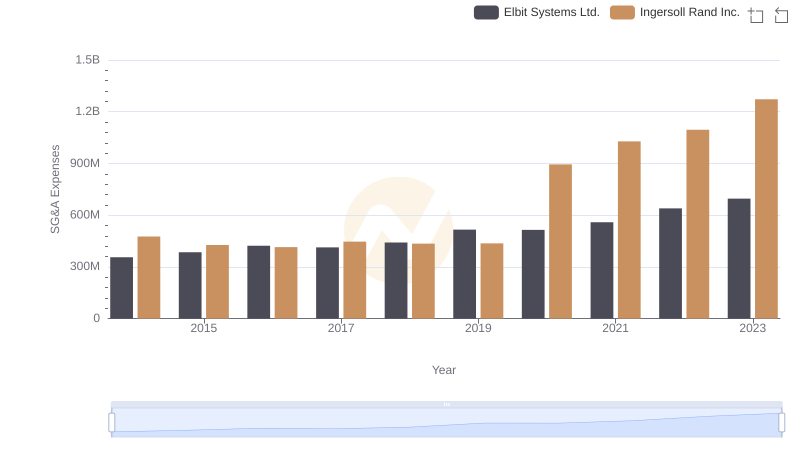
SG&A Efficiency Analysis: Comparing Ingersoll Rand Inc. and Elbit Systems Ltd.
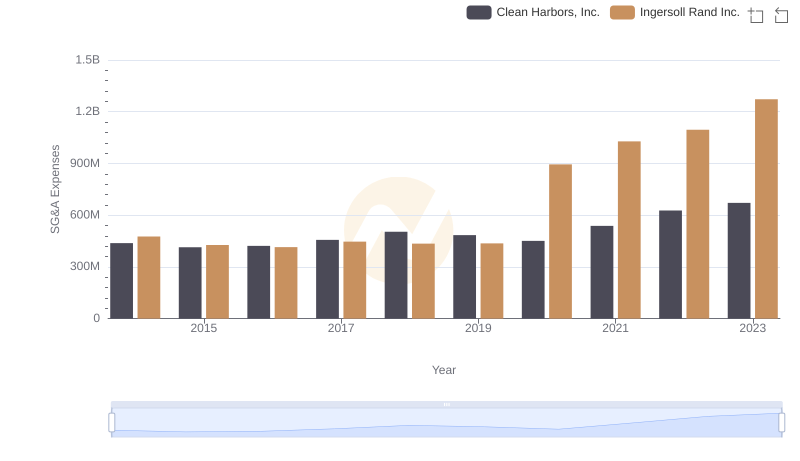
Ingersoll Rand Inc. vs Clean Harbors, Inc.: SG&A Expense Trends
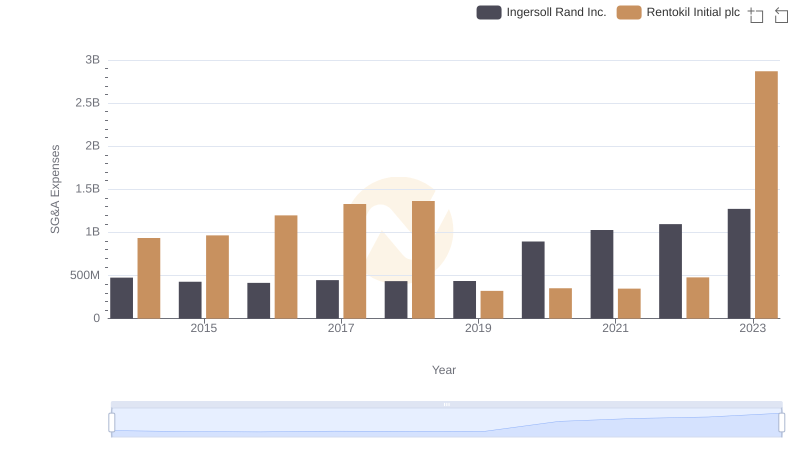
Ingersoll Rand Inc. and Rentokil Initial plc: SG&A Spending Patterns Compared
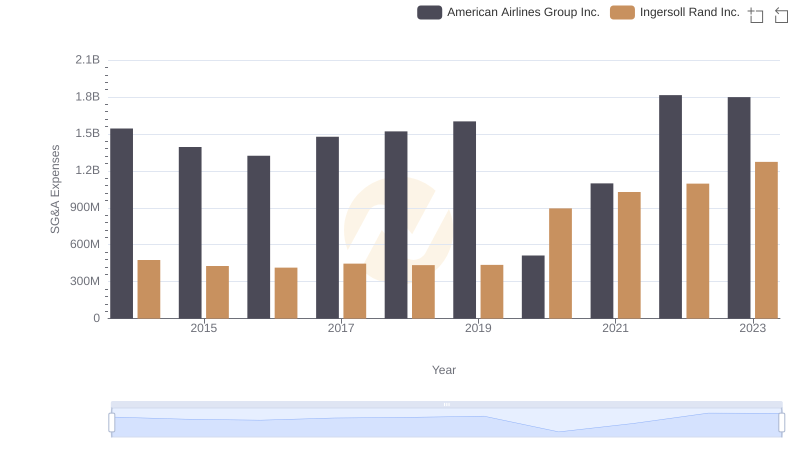
Cost Management Insights: SG&A Expenses for Ingersoll Rand Inc. and American Airlines Group Inc.