| __timestamp | Elbit Systems Ltd. | Ingersoll Rand Inc. |
|---|---|---|
| Wednesday, January 1, 2014 | 2133151000 | 1633224000 |
| Thursday, January 1, 2015 | 2210528000 | 1347800000 |
| Friday, January 1, 2016 | 2300636000 | 1222705000 |
| Sunday, January 1, 2017 | 2379905000 | 1477500000 |
| Monday, January 1, 2018 | 2707505000 | 1677300000 |
| Tuesday, January 1, 2019 | 3371933000 | 1540200000 |
| Wednesday, January 1, 2020 | 3497465000 | 3296800000 |
| Friday, January 1, 2021 | 3920473000 | 3163900000 |
| Saturday, January 1, 2022 | 4138266000 | 3590700000 |
| Sunday, January 1, 2023 | 4491790000 | 3993900000 |
| Monday, January 1, 2024 | 0 |
Unveiling the hidden dimensions of data
In the ever-evolving landscape of global industries, understanding cost dynamics is crucial. This analysis delves into the cost of revenue trends for Ingersoll Rand Inc. and Elbit Systems Ltd. over the past decade. From 2014 to 2023, Elbit Systems Ltd. has seen a steady increase in its cost of revenue, growing by approximately 110%, reflecting its expanding operations and market reach. Ingersoll Rand Inc., on the other hand, experienced a significant surge in 2020, with costs nearly doubling compared to previous years, likely due to strategic acquisitions and market expansion. By 2023, both companies have shown robust growth, with Elbit Systems Ltd. leading by a margin of about 12% over Ingersoll Rand Inc. This trend highlights the dynamic nature of cost management in the industrial sector, offering insights into strategic financial planning and operational efficiency.
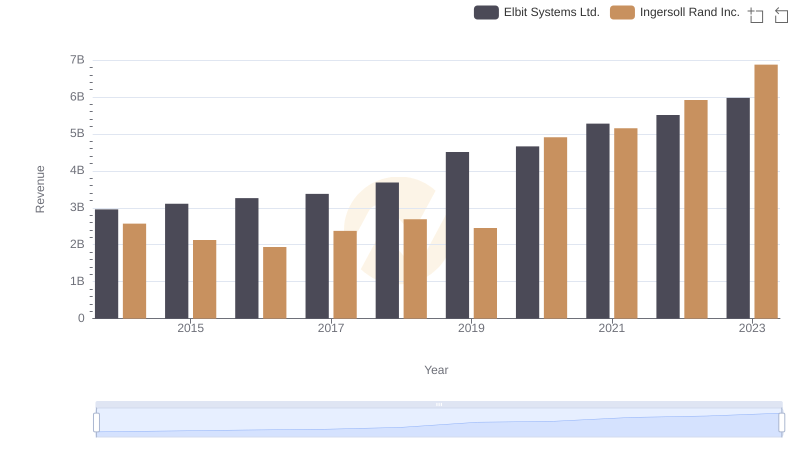
Comparing Revenue Performance: Ingersoll Rand Inc. or Elbit Systems Ltd.?
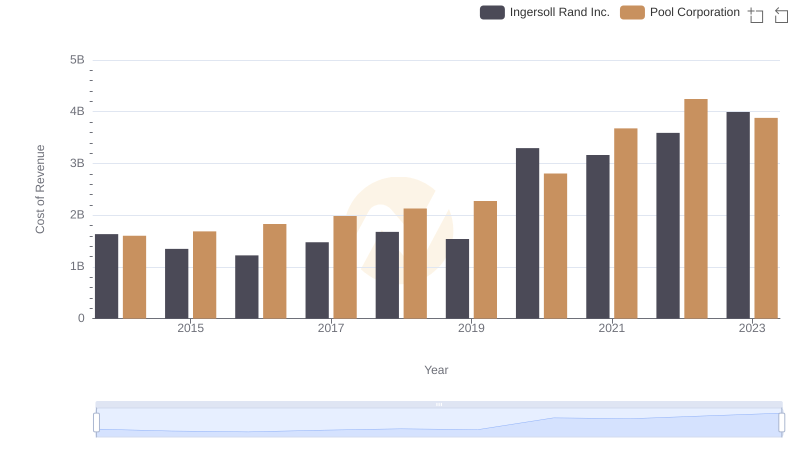
Cost Insights: Breaking Down Ingersoll Rand Inc. and Pool Corporation's Expenses
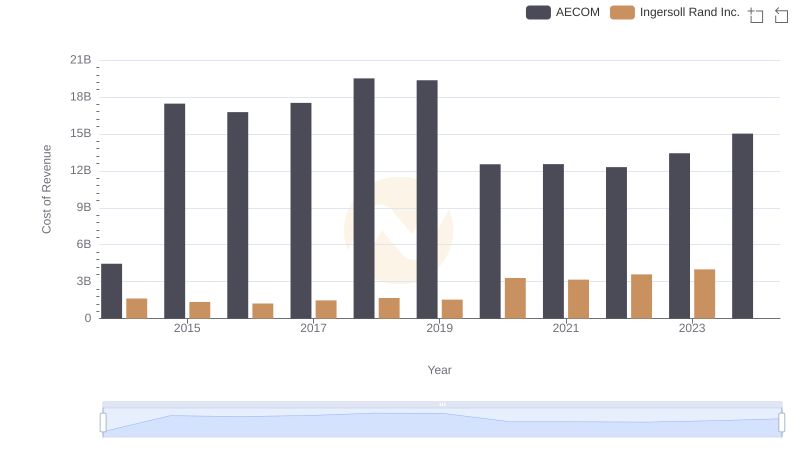
Cost Insights: Breaking Down Ingersoll Rand Inc. and AECOM's Expenses
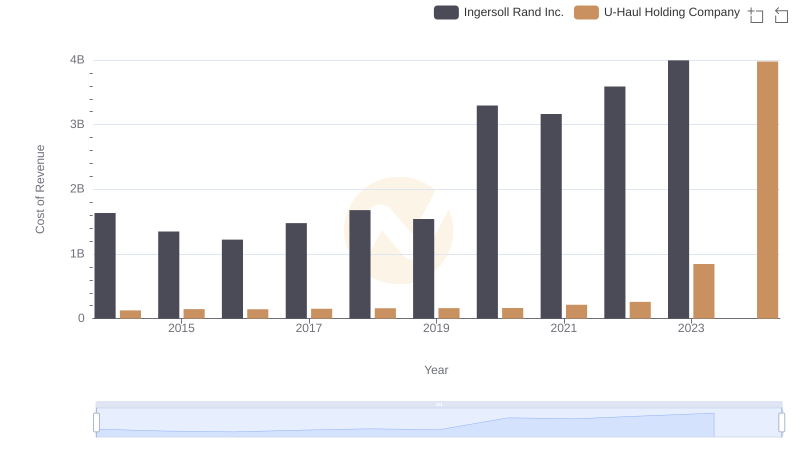
Ingersoll Rand Inc. vs U-Haul Holding Company: Efficiency in Cost of Revenue Explored
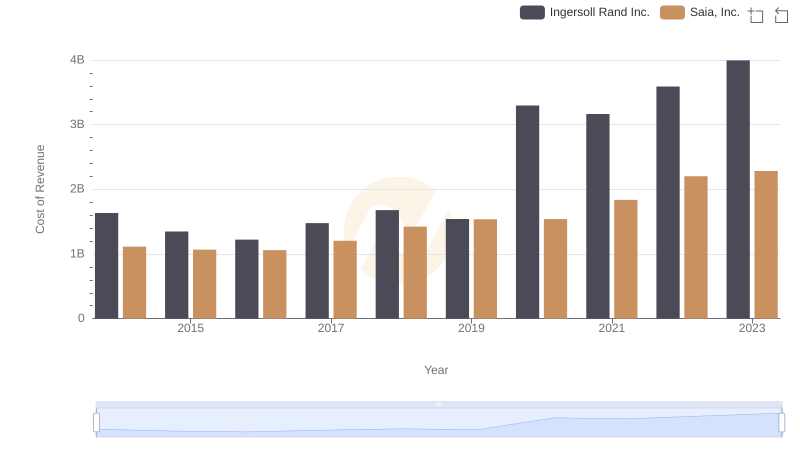
Cost of Revenue: Key Insights for Ingersoll Rand Inc. and Saia, Inc.
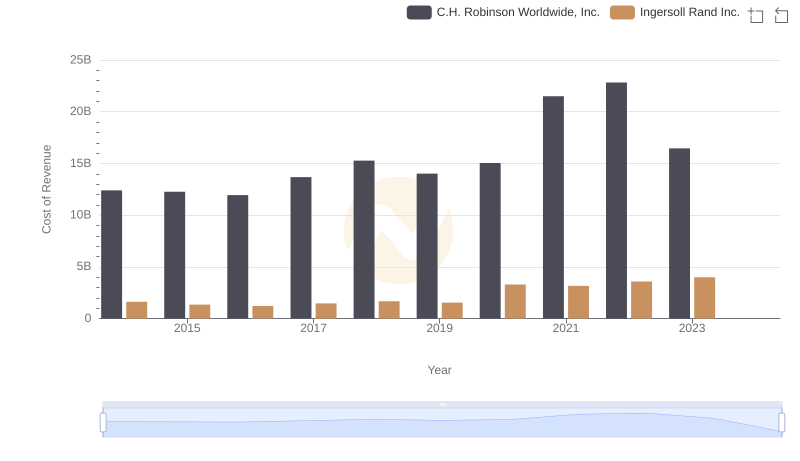
Cost Insights: Breaking Down Ingersoll Rand Inc. and C.H. Robinson Worldwide, Inc.'s Expenses
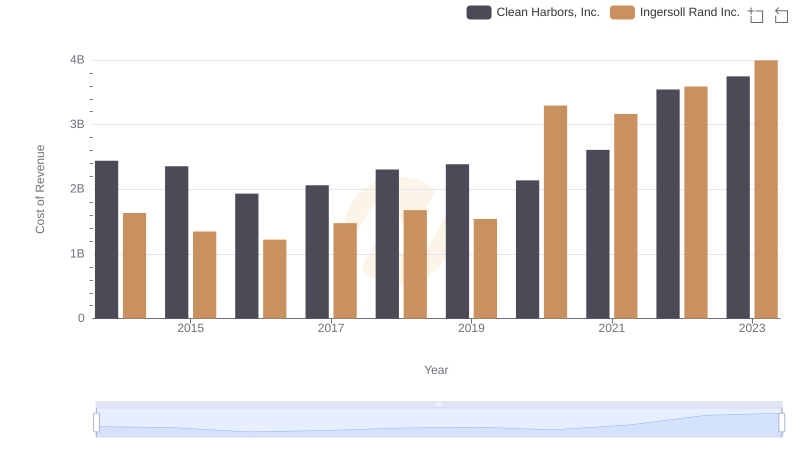
Cost of Revenue: Key Insights for Ingersoll Rand Inc. and Clean Harbors, Inc.
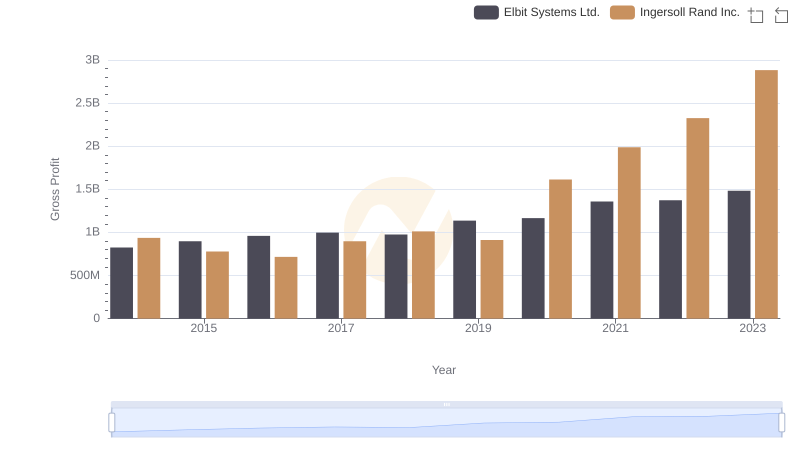
Gross Profit Analysis: Comparing Ingersoll Rand Inc. and Elbit Systems Ltd.
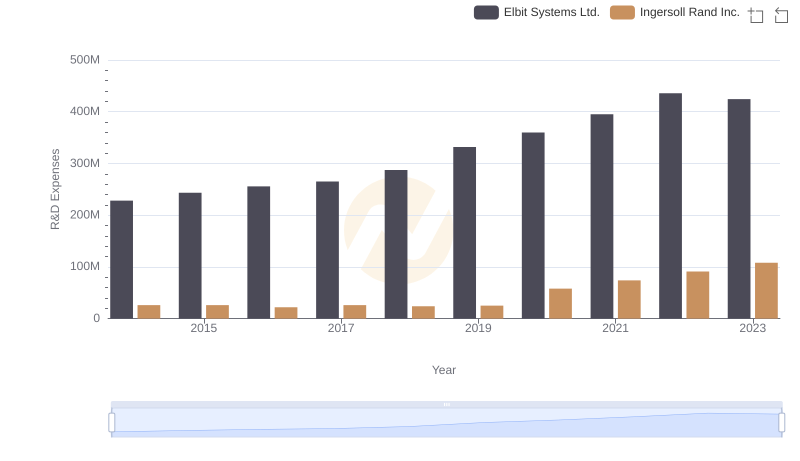
Ingersoll Rand Inc. vs Elbit Systems Ltd.: Strategic Focus on R&D Spending
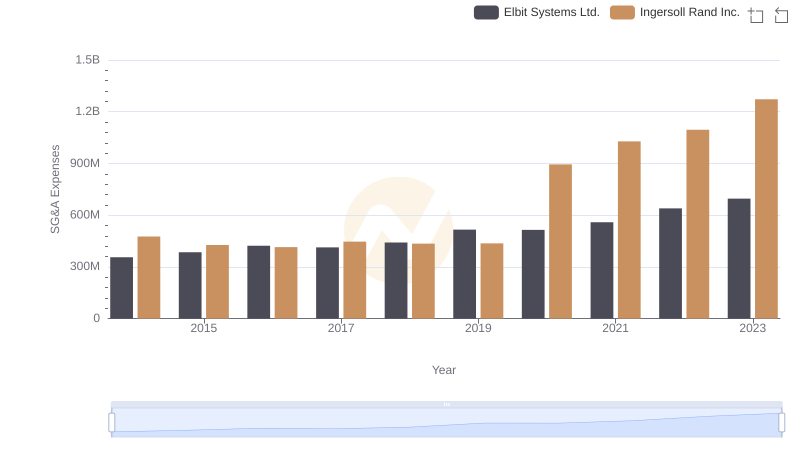
SG&A Efficiency Analysis: Comparing Ingersoll Rand Inc. and Elbit Systems Ltd.