| __timestamp | Ingersoll Rand Inc. | Saia, Inc. |
|---|---|---|
| Wednesday, January 1, 2014 | 1633224000 | 1113053000 |
| Thursday, January 1, 2015 | 1347800000 | 1067191000 |
| Friday, January 1, 2016 | 1222705000 | 1058979000 |
| Sunday, January 1, 2017 | 1477500000 | 1203464000 |
| Monday, January 1, 2018 | 1677300000 | 1423779000 |
| Tuesday, January 1, 2019 | 1540200000 | 1537082000 |
| Wednesday, January 1, 2020 | 3296800000 | 1538518000 |
| Friday, January 1, 2021 | 3163900000 | 1837017000 |
| Saturday, January 1, 2022 | 3590700000 | 2201094000 |
| Sunday, January 1, 2023 | 3993900000 | 2282501000 |
| Monday, January 1, 2024 | 0 |
In pursuit of knowledge
In the ever-evolving landscape of industrial and transportation sectors, understanding cost dynamics is crucial. From 2014 to 2023, Ingersoll Rand Inc. and Saia, Inc. have shown distinct trajectories in their cost of revenue. Ingersoll Rand Inc. experienced a significant surge, with costs increasing by approximately 145% over the decade, peaking in 2023. This reflects strategic expansions and possibly increased operational efficiencies. Meanwhile, Saia, Inc. saw a steady rise of about 105%, indicating consistent growth in its logistics operations. Notably, 2020 marked a pivotal year for both companies, with Ingersoll Rand's costs nearly doubling, likely due to global disruptions. These insights underscore the importance of cost management in maintaining competitive advantage. As industries continue to adapt, monitoring these trends offers valuable foresight into future financial strategies.
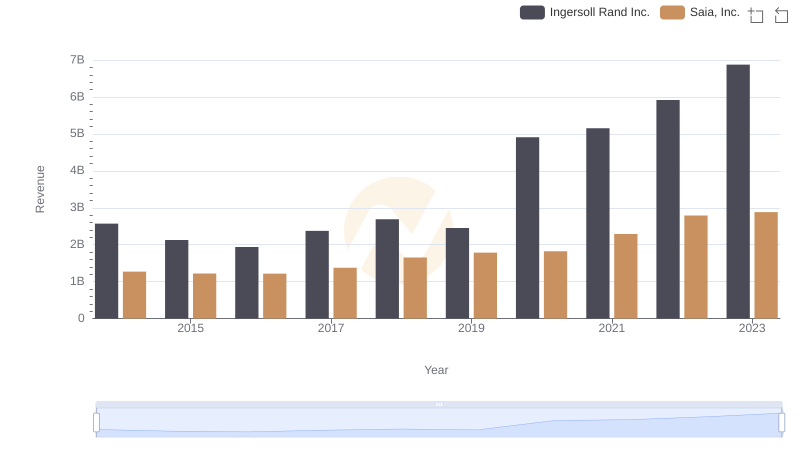
Ingersoll Rand Inc. and Saia, Inc.: A Comprehensive Revenue Analysis
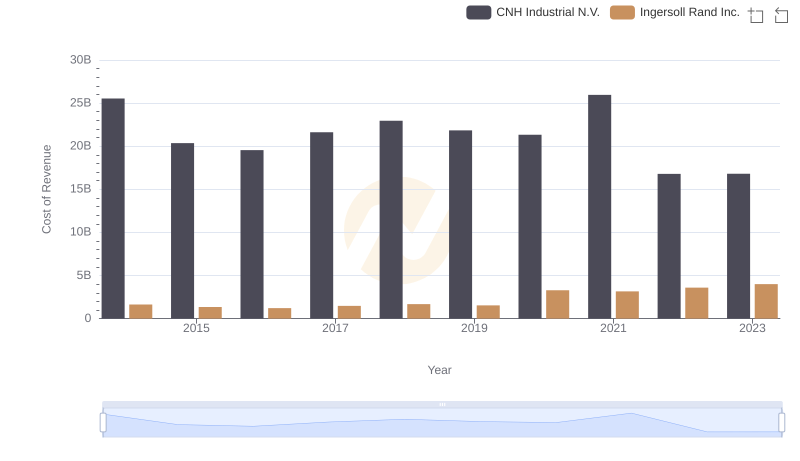
Cost of Revenue Trends: Ingersoll Rand Inc. vs CNH Industrial N.V.
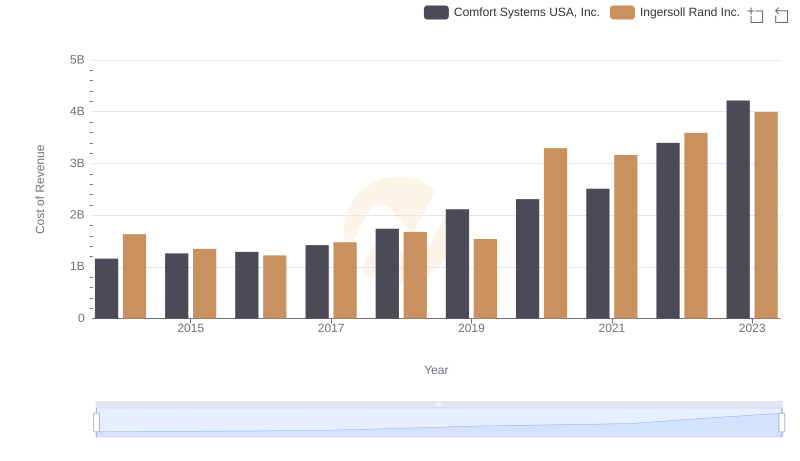
Analyzing Cost of Revenue: Ingersoll Rand Inc. and Comfort Systems USA, Inc.
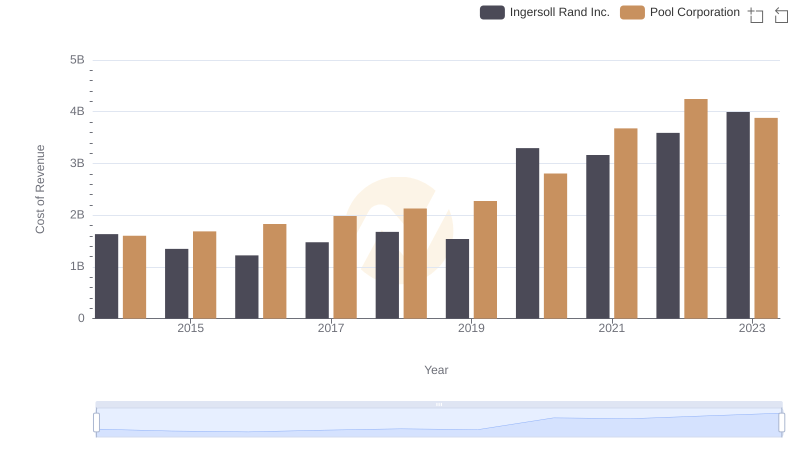
Cost Insights: Breaking Down Ingersoll Rand Inc. and Pool Corporation's Expenses
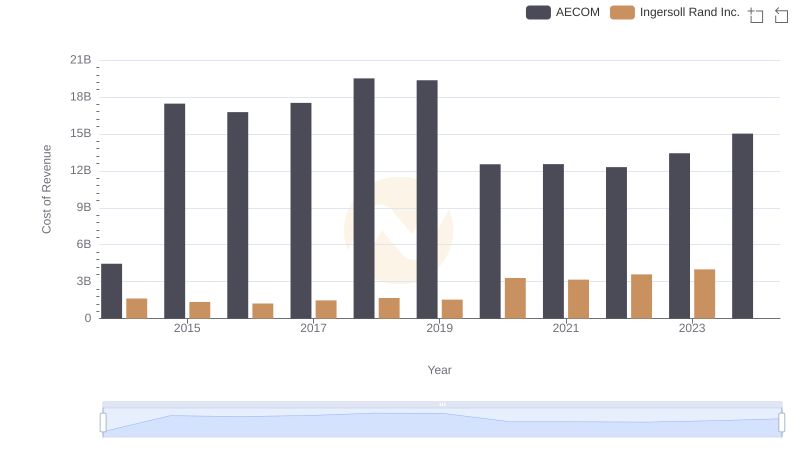
Cost Insights: Breaking Down Ingersoll Rand Inc. and AECOM's Expenses
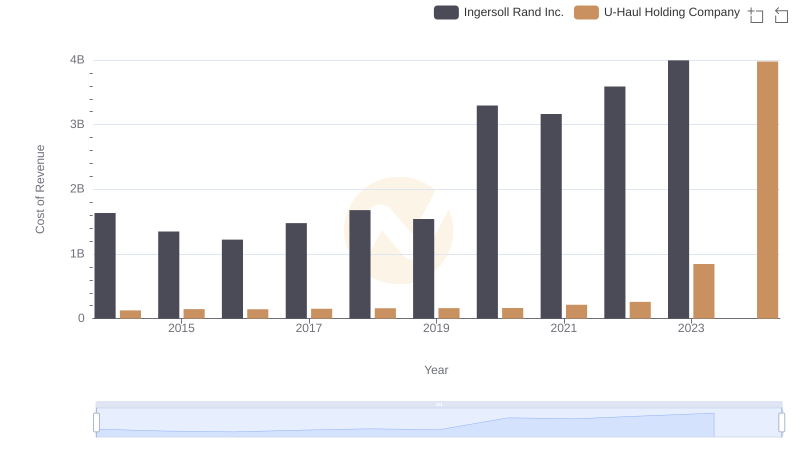
Ingersoll Rand Inc. vs U-Haul Holding Company: Efficiency in Cost of Revenue Explored
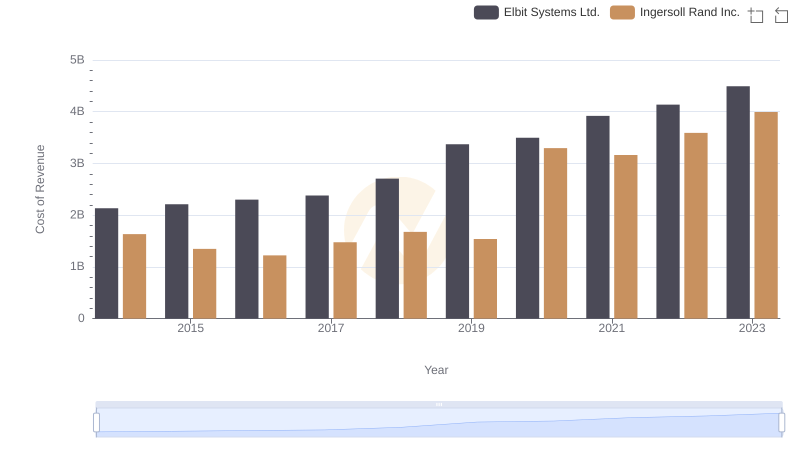
Cost of Revenue Trends: Ingersoll Rand Inc. vs Elbit Systems Ltd.
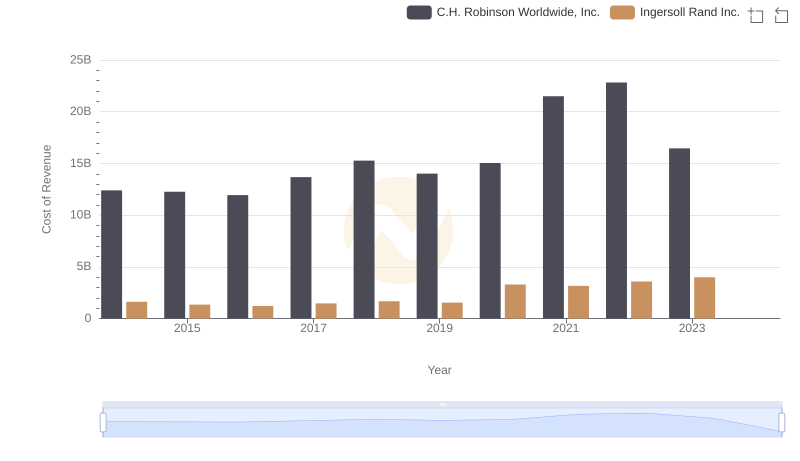
Cost Insights: Breaking Down Ingersoll Rand Inc. and C.H. Robinson Worldwide, Inc.'s Expenses
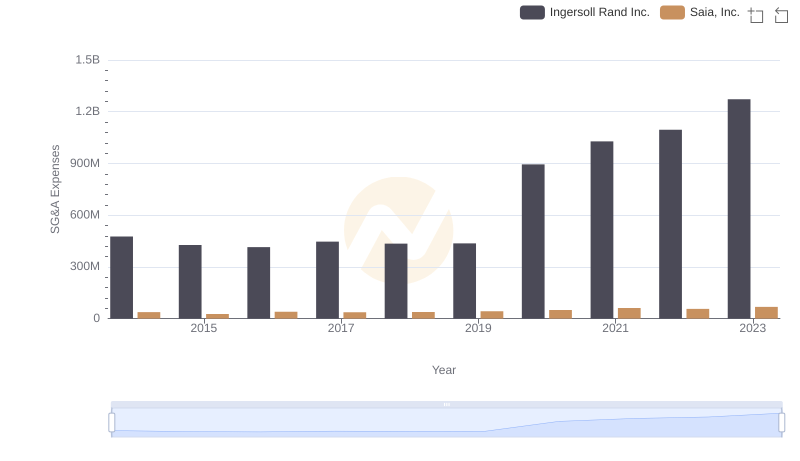
SG&A Efficiency Analysis: Comparing Ingersoll Rand Inc. and Saia, Inc.