| __timestamp | AECOM | Ingersoll Rand Inc. |
|---|---|---|
| Wednesday, January 1, 2014 | 4452451000 | 1633224000 |
| Thursday, January 1, 2015 | 17454692000 | 1347800000 |
| Friday, January 1, 2016 | 16768001000 | 1222705000 |
| Sunday, January 1, 2017 | 17519682000 | 1477500000 |
| Monday, January 1, 2018 | 19504863000 | 1677300000 |
| Tuesday, January 1, 2019 | 19359884000 | 1540200000 |
| Wednesday, January 1, 2020 | 12530416000 | 3296800000 |
| Friday, January 1, 2021 | 12542431000 | 3163900000 |
| Saturday, January 1, 2022 | 12300208000 | 3590700000 |
| Sunday, January 1, 2023 | 13432996000 | 3993900000 |
| Monday, January 1, 2024 | 15021157000 | 0 |
Cracking the code
In the ever-evolving landscape of industrial and infrastructure sectors, understanding cost dynamics is crucial. Ingersoll Rand Inc. and AECOM, two titans in their respective fields, offer a fascinating study in contrasts. Over the past decade, AECOM's cost of revenue has shown a robust upward trend, peaking in 2018 with a 33% increase from 2014. Meanwhile, Ingersoll Rand Inc. experienced a more volatile journey, with a notable spike in 2023, marking a 145% rise from its 2014 figures.
From 2014 to 2023, AECOM consistently outpaced Ingersoll Rand Inc. in terms of cost of revenue, reflecting its expansive operations in global infrastructure projects. However, the data for 2024 remains incomplete, leaving room for speculation on future trends. This analysis underscores the importance of strategic cost management in maintaining competitive advantage.

Ingersoll Rand Inc. vs AECOM: Examining Key Revenue Metrics
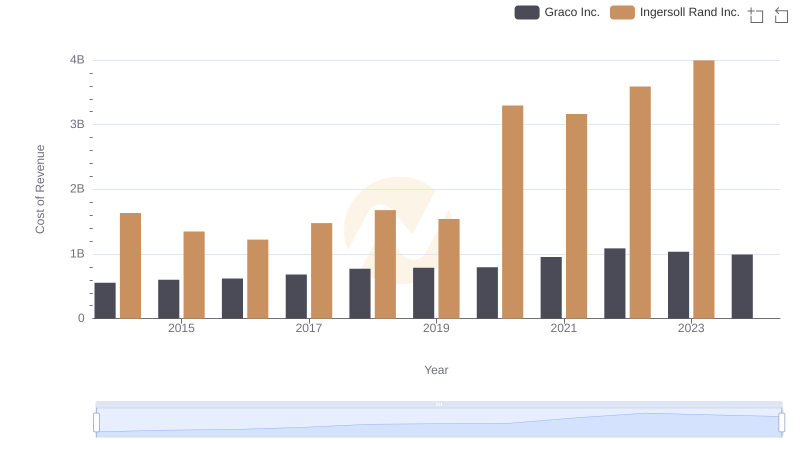
Cost of Revenue Comparison: Ingersoll Rand Inc. vs Graco Inc.
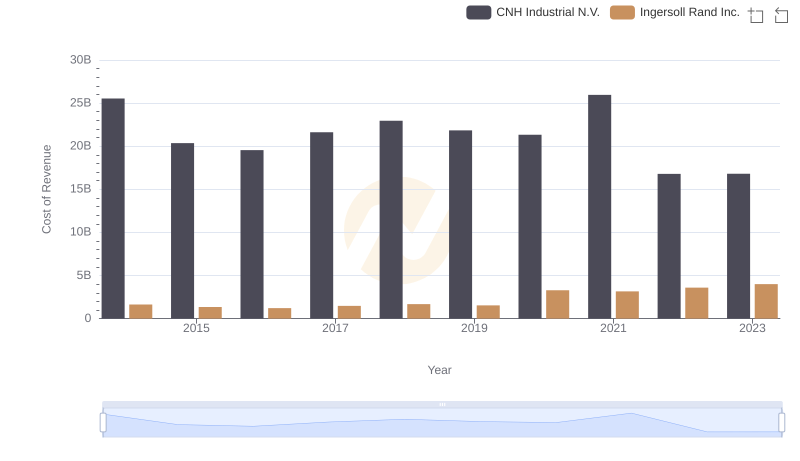
Cost of Revenue Trends: Ingersoll Rand Inc. vs CNH Industrial N.V.
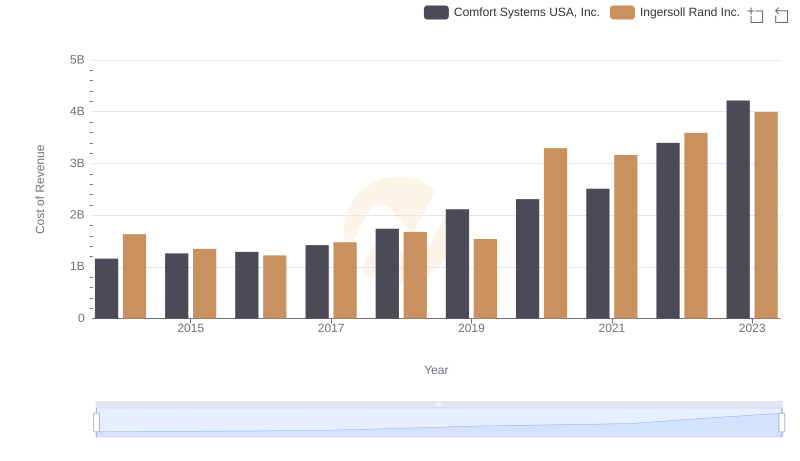
Analyzing Cost of Revenue: Ingersoll Rand Inc. and Comfort Systems USA, Inc.
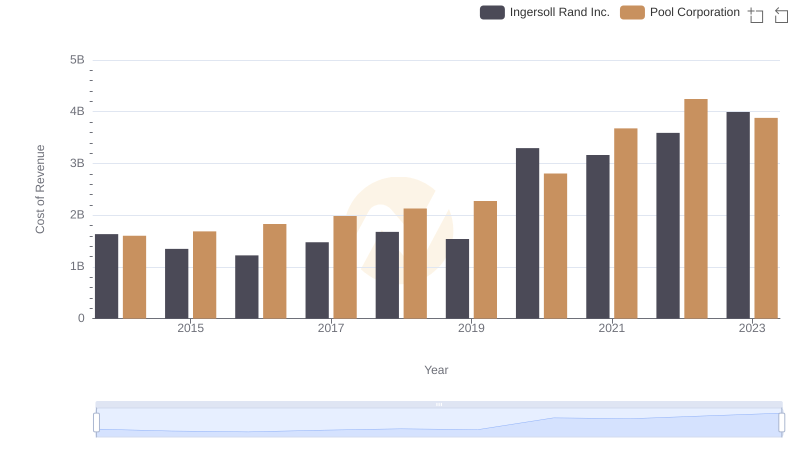
Cost Insights: Breaking Down Ingersoll Rand Inc. and Pool Corporation's Expenses
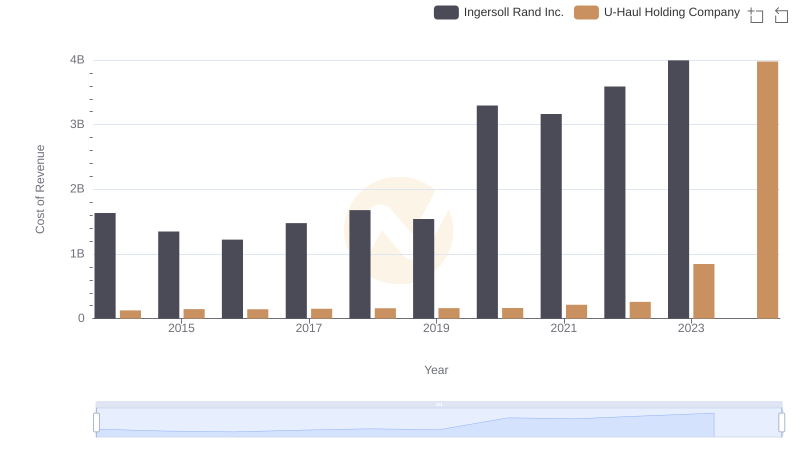
Ingersoll Rand Inc. vs U-Haul Holding Company: Efficiency in Cost of Revenue Explored
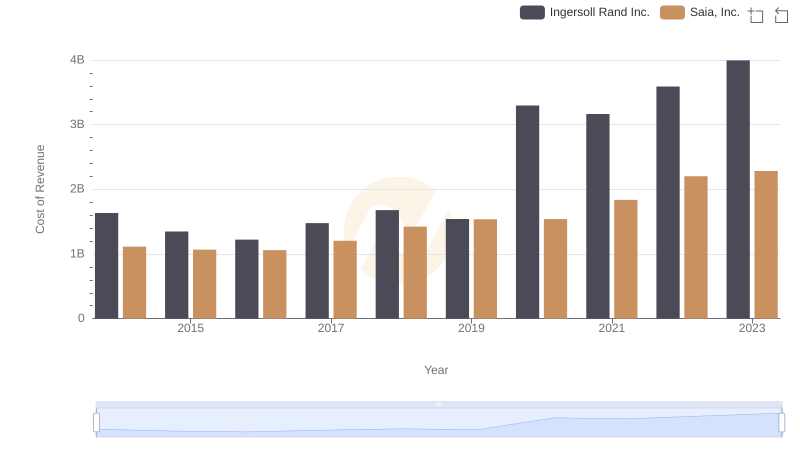
Cost of Revenue: Key Insights for Ingersoll Rand Inc. and Saia, Inc.
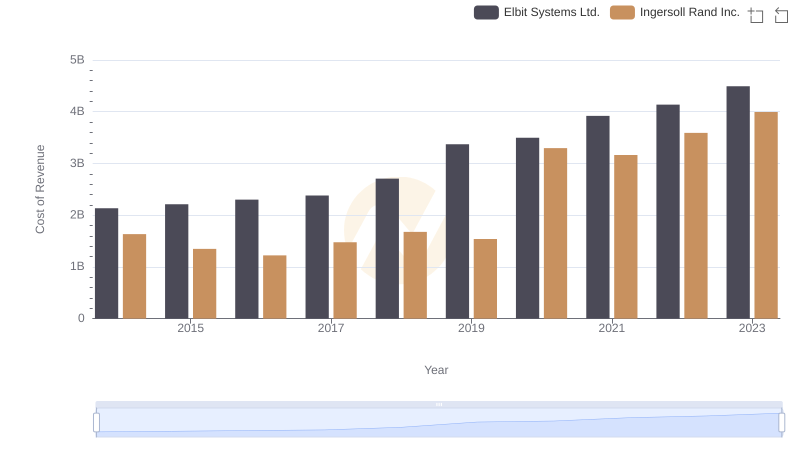
Cost of Revenue Trends: Ingersoll Rand Inc. vs Elbit Systems Ltd.
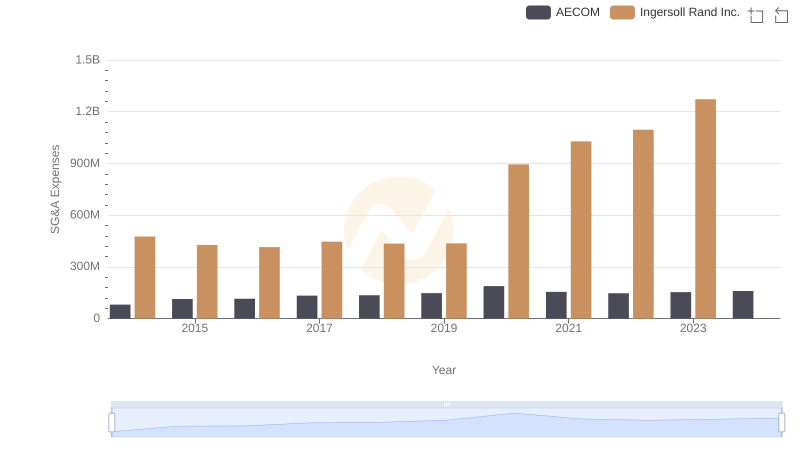
Ingersoll Rand Inc. or AECOM: Who Manages SG&A Costs Better?