| __timestamp | Clean Harbors, Inc. | Ingersoll Rand Inc. |
|---|---|---|
| Wednesday, January 1, 2014 | 2441796000 | 1633224000 |
| Thursday, January 1, 2015 | 2356806000 | 1347800000 |
| Friday, January 1, 2016 | 1932857000 | 1222705000 |
| Sunday, January 1, 2017 | 2062673000 | 1477500000 |
| Monday, January 1, 2018 | 2305551000 | 1677300000 |
| Tuesday, January 1, 2019 | 2387819000 | 1540200000 |
| Wednesday, January 1, 2020 | 2137751000 | 3296800000 |
| Friday, January 1, 2021 | 2609837000 | 3163900000 |
| Saturday, January 1, 2022 | 3543930000 | 3590700000 |
| Sunday, January 1, 2023 | 3746124000 | 3993900000 |
| Monday, January 1, 2024 | 4065713000 | 0 |
In pursuit of knowledge
In the ever-evolving landscape of industrial giants, understanding cost structures is pivotal. Over the past decade, from 2014 to 2023, Ingersoll Rand Inc. and Clean Harbors, Inc. have showcased intriguing trends in their cost of revenue. Clean Harbors, Inc. has seen a steady increase, with costs rising by approximately 54% from 2014 to 2023. This growth reflects their expanding operations and market reach. In contrast, Ingersoll Rand Inc. experienced a more volatile trajectory, with a significant spike in 2020, where costs surged by nearly 115% compared to 2019. This peak aligns with strategic shifts and market adaptations. By 2023, both companies reached their highest cost levels, with Ingersoll Rand Inc. leading slightly. These insights underscore the dynamic nature of cost management in the industrial sector, highlighting the importance of strategic planning and market responsiveness.
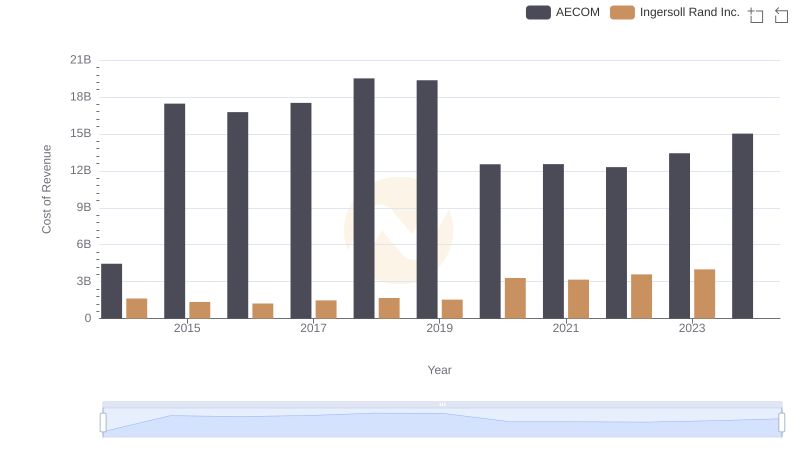
Cost Insights: Breaking Down Ingersoll Rand Inc. and AECOM's Expenses
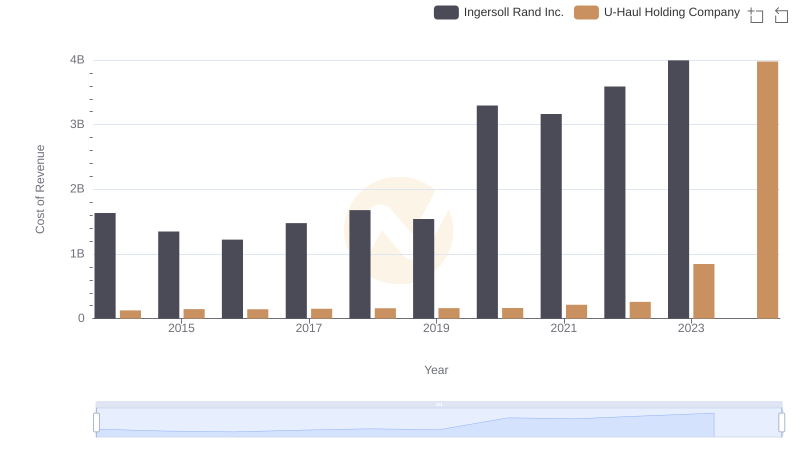
Ingersoll Rand Inc. vs U-Haul Holding Company: Efficiency in Cost of Revenue Explored
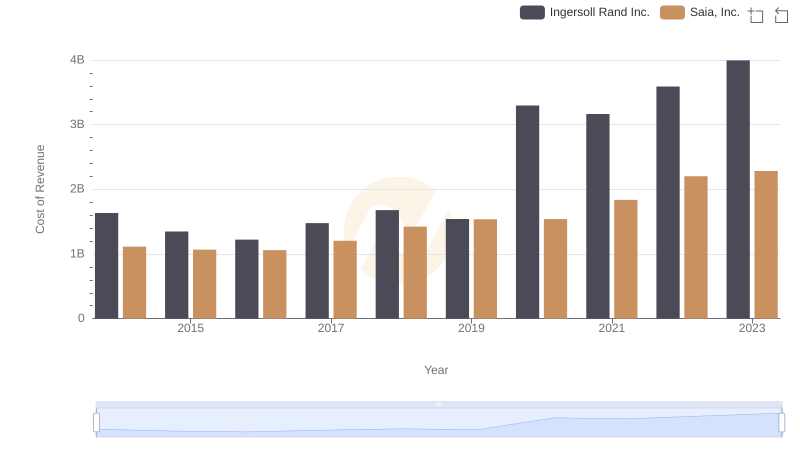
Cost of Revenue: Key Insights for Ingersoll Rand Inc. and Saia, Inc.
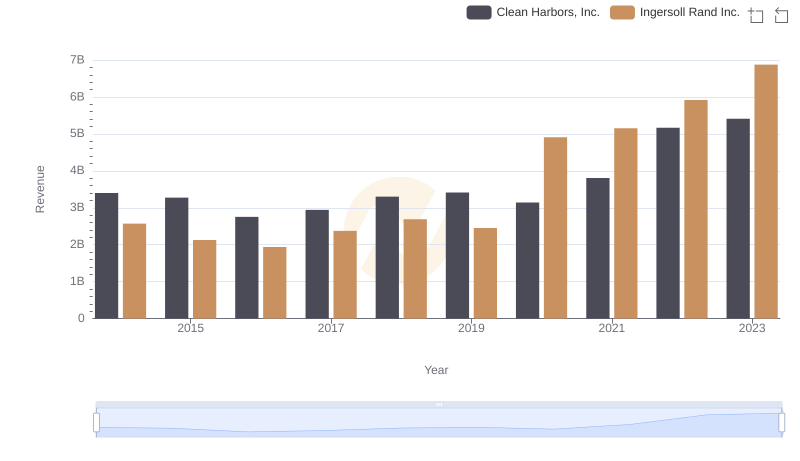
Comparing Revenue Performance: Ingersoll Rand Inc. or Clean Harbors, Inc.?
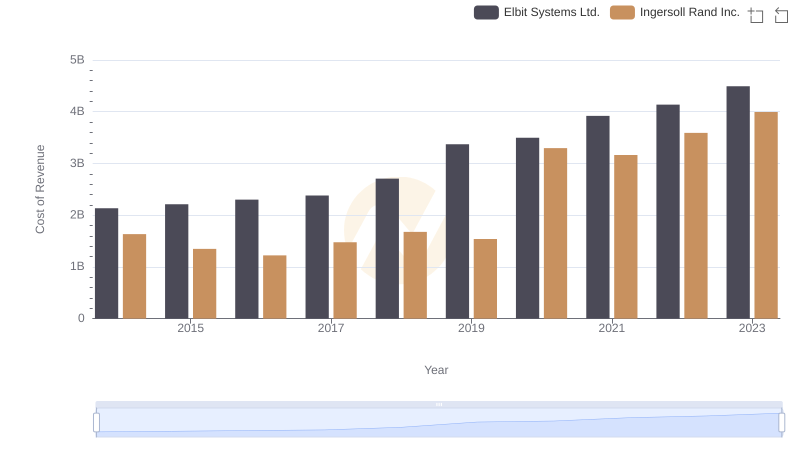
Cost of Revenue Trends: Ingersoll Rand Inc. vs Elbit Systems Ltd.
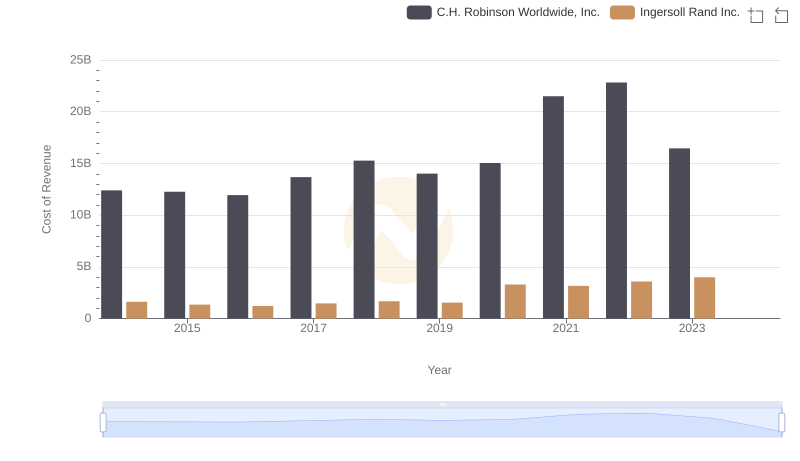
Cost Insights: Breaking Down Ingersoll Rand Inc. and C.H. Robinson Worldwide, Inc.'s Expenses
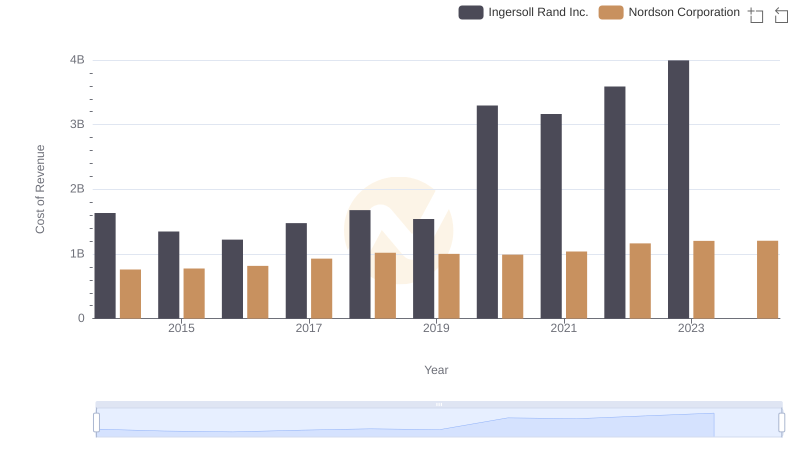
Cost of Revenue Comparison: Ingersoll Rand Inc. vs Nordson Corporation
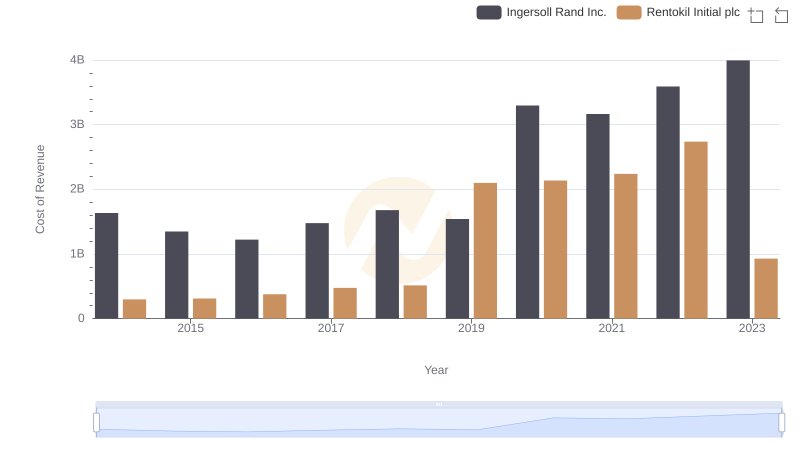
Cost of Revenue Comparison: Ingersoll Rand Inc. vs Rentokil Initial plc
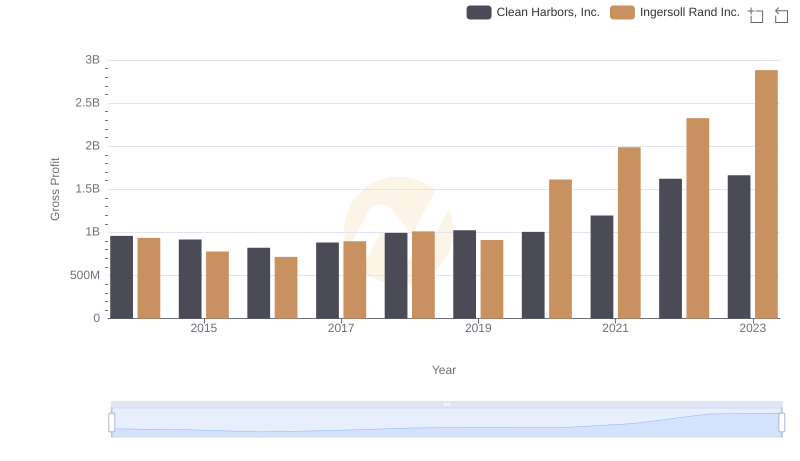
Who Generates Higher Gross Profit? Ingersoll Rand Inc. or Clean Harbors, Inc.
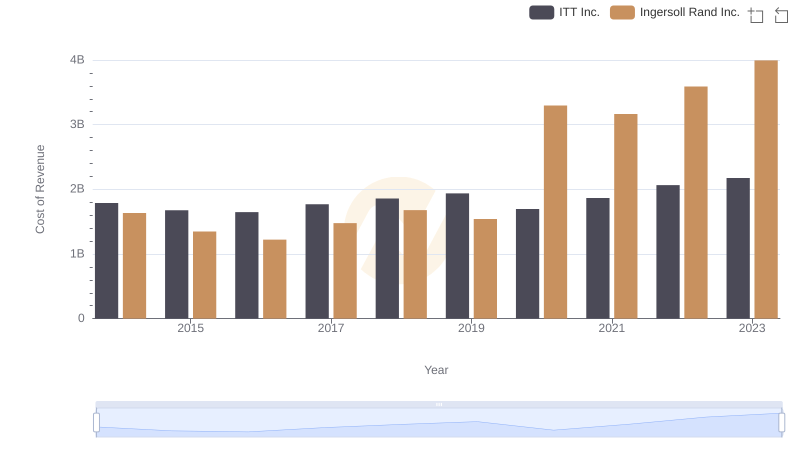
Ingersoll Rand Inc. vs ITT Inc.: Efficiency in Cost of Revenue Explored
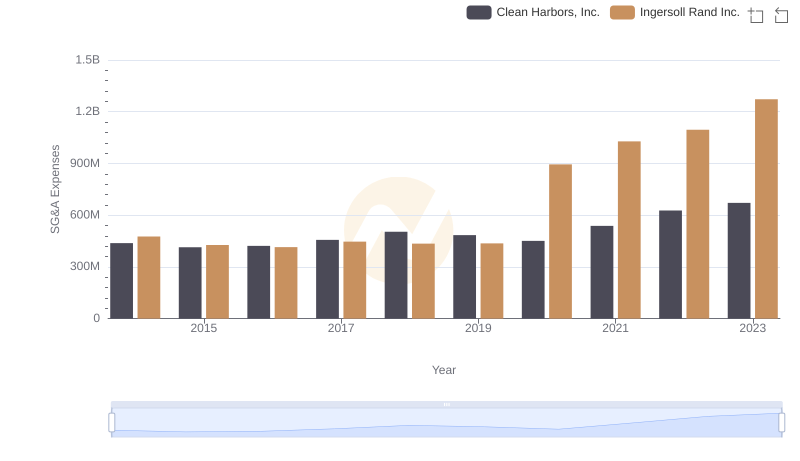
Ingersoll Rand Inc. vs Clean Harbors, Inc.: SG&A Expense Trends