| __timestamp | ITT Inc. | Ingersoll Rand Inc. |
|---|---|---|
| Wednesday, January 1, 2014 | 1788200000 | 1633224000 |
| Thursday, January 1, 2015 | 1676500000 | 1347800000 |
| Friday, January 1, 2016 | 1647200000 | 1222705000 |
| Sunday, January 1, 2017 | 1768100000 | 1477500000 |
| Monday, January 1, 2018 | 1857900000 | 1677300000 |
| Tuesday, January 1, 2019 | 1936300000 | 1540200000 |
| Wednesday, January 1, 2020 | 1695600000 | 3296800000 |
| Friday, January 1, 2021 | 1865500000 | 3163900000 |
| Saturday, January 1, 2022 | 2065400000 | 3590700000 |
| Sunday, January 1, 2023 | 2175700000 | 3993900000 |
| Monday, January 1, 2024 | 2383400000 | 0 |
Cracking the code
In the competitive landscape of industrial manufacturing, cost efficiency is a critical metric. This analysis delves into the cost of revenue trends for Ingersoll Rand Inc. and ITT Inc. from 2014 to 2023. Over this period, Ingersoll Rand Inc. demonstrated a significant increase in cost efficiency, with their cost of revenue rising by approximately 145%, from $1.63 billion in 2014 to nearly $4 billion in 2023. In contrast, ITT Inc. experienced a more modest increase of around 22%, from $1.79 billion to $2.18 billion. This stark difference highlights Ingersoll Rand's aggressive growth strategy and operational scaling. The data suggests that while both companies have expanded, Ingersoll Rand's approach has been more capital-intensive, potentially reflecting a broader market capture strategy. Understanding these trends is crucial for investors and industry analysts aiming to gauge future performance and strategic direction.
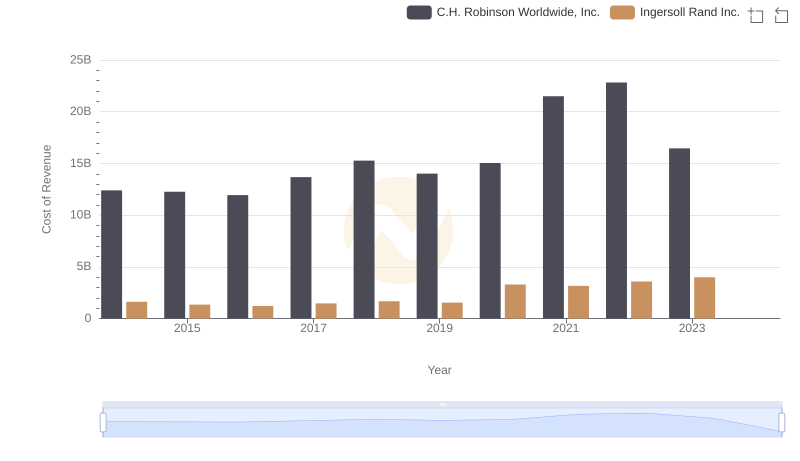
Cost Insights: Breaking Down Ingersoll Rand Inc. and C.H. Robinson Worldwide, Inc.'s Expenses
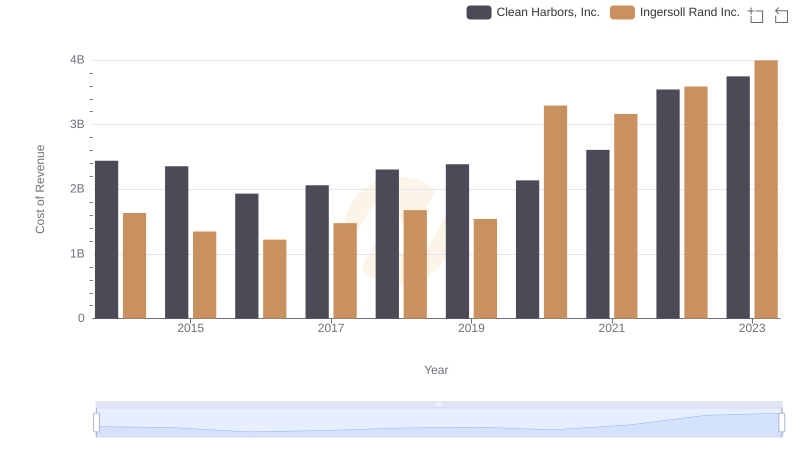
Cost of Revenue: Key Insights for Ingersoll Rand Inc. and Clean Harbors, Inc.
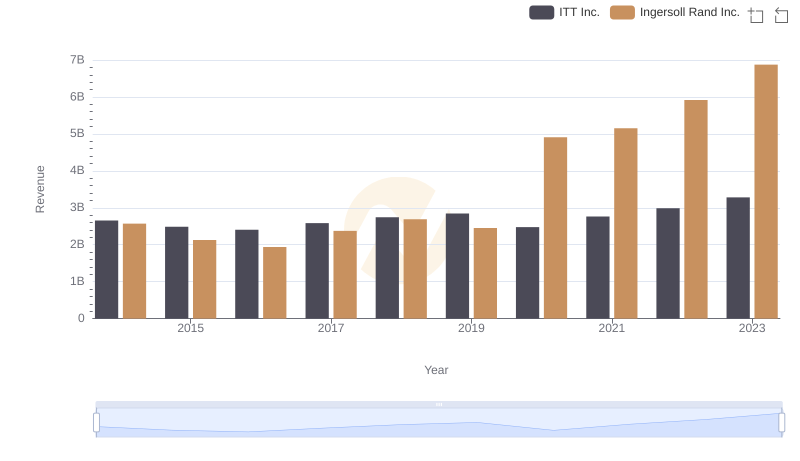
Ingersoll Rand Inc. or ITT Inc.: Who Leads in Yearly Revenue?
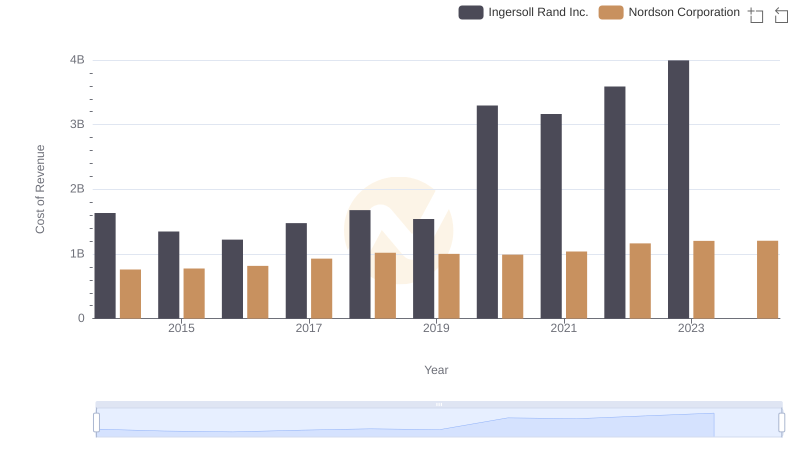
Cost of Revenue Comparison: Ingersoll Rand Inc. vs Nordson Corporation
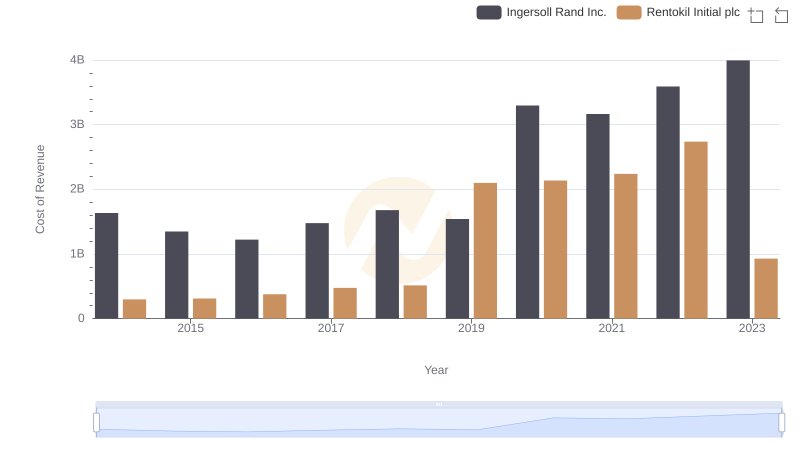
Cost of Revenue Comparison: Ingersoll Rand Inc. vs Rentokil Initial plc
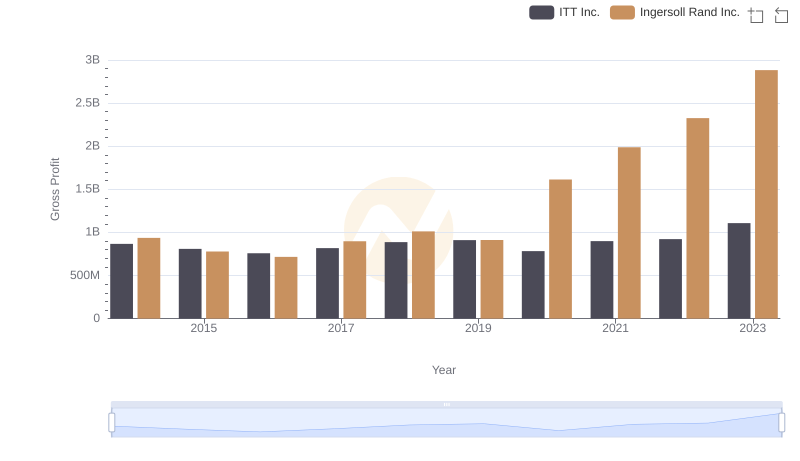
Gross Profit Comparison: Ingersoll Rand Inc. and ITT Inc. Trends
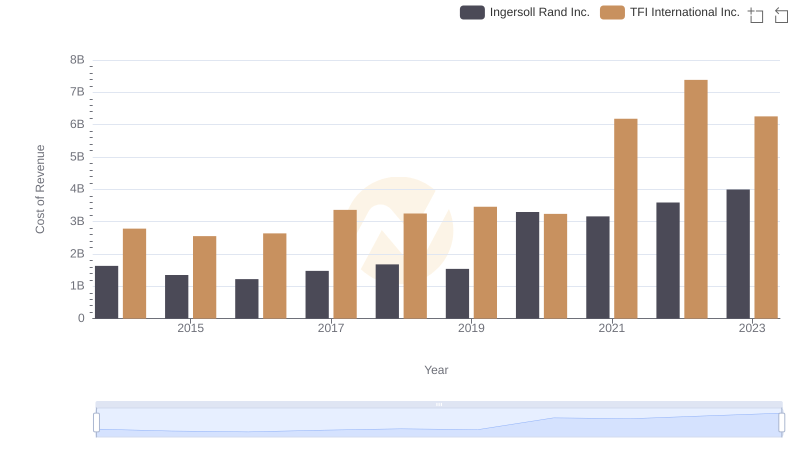
Cost of Revenue: Key Insights for Ingersoll Rand Inc. and TFI International Inc.
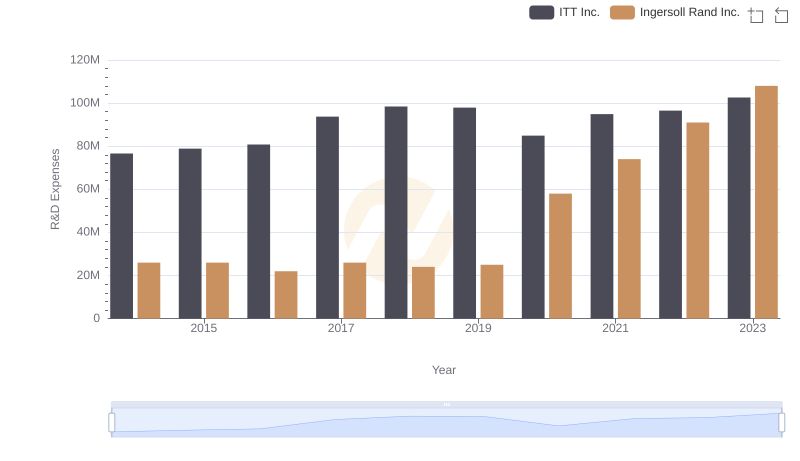
Comparing Innovation Spending: Ingersoll Rand Inc. and ITT Inc.