| __timestamp | Ingersoll Rand Inc. | Rentokil Initial plc |
|---|---|---|
| Wednesday, January 1, 2014 | 1633224000 | 297500000 |
| Thursday, January 1, 2015 | 1347800000 | 310200000 |
| Friday, January 1, 2016 | 1222705000 | 376100000 |
| Sunday, January 1, 2017 | 1477500000 | 474900000 |
| Monday, January 1, 2018 | 1677300000 | 514200000 |
| Tuesday, January 1, 2019 | 1540200000 | 2099000000 |
| Wednesday, January 1, 2020 | 3296800000 | 2136400000 |
| Friday, January 1, 2021 | 3163900000 | 2239100000 |
| Saturday, January 1, 2022 | 3590700000 | 2737000000 |
| Sunday, January 1, 2023 | 3993900000 | 927000000 |
| Monday, January 1, 2024 | 0 |
Infusing magic into the data realm
In the ever-evolving landscape of global business, understanding the cost of revenue is crucial for evaluating a company's efficiency and profitability. This chart offers a fascinating comparison between Ingersoll Rand Inc. and Rentokil Initial plc over the past decade.
From 2014 to 2023, Ingersoll Rand Inc. has seen a remarkable 145% increase in its cost of revenue, peaking at nearly $4 billion in 2023. This growth reflects the company's expanding operations and market reach.
Rentokil Initial plc, on the other hand, experienced a more volatile journey. After a significant rise in 2019, reaching over $2 billion, the cost of revenue dropped by 66% in 2023. This fluctuation highlights the dynamic challenges faced by the company in recent years.
This comparison not only underscores the diverse strategies of these industry leaders but also provides valuable insights into their financial health and operational strategies.
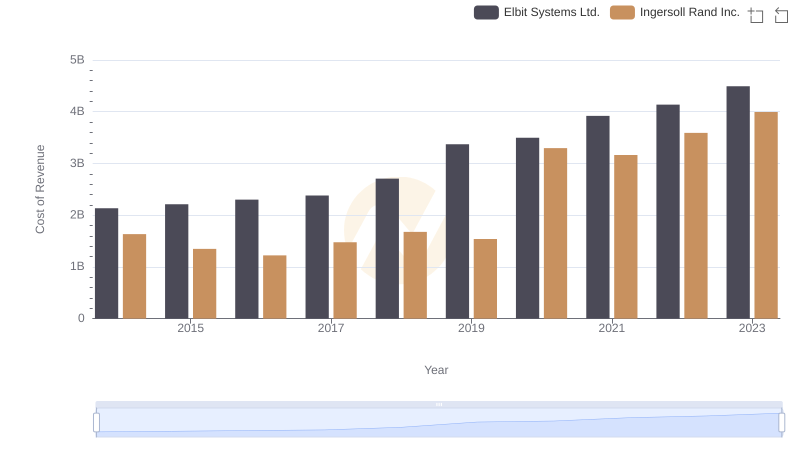
Cost of Revenue Trends: Ingersoll Rand Inc. vs Elbit Systems Ltd.
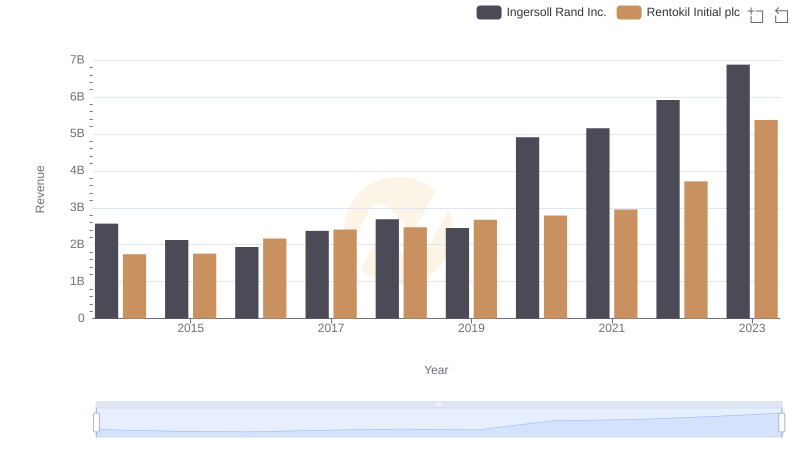
Comparing Revenue Performance: Ingersoll Rand Inc. or Rentokil Initial plc?
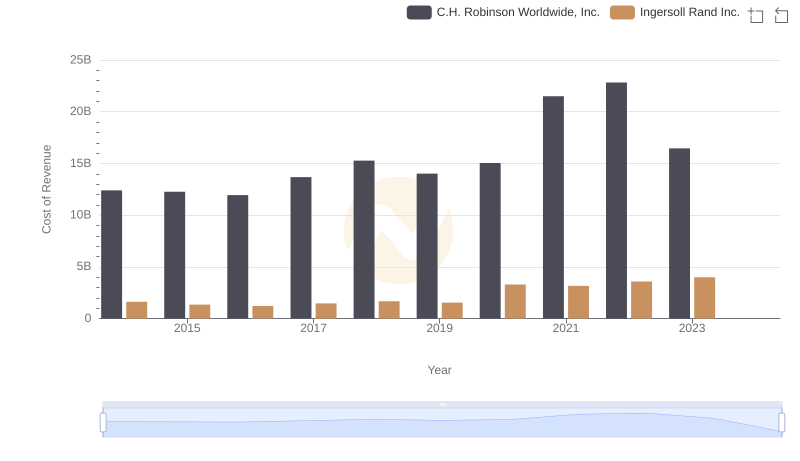
Cost Insights: Breaking Down Ingersoll Rand Inc. and C.H. Robinson Worldwide, Inc.'s Expenses
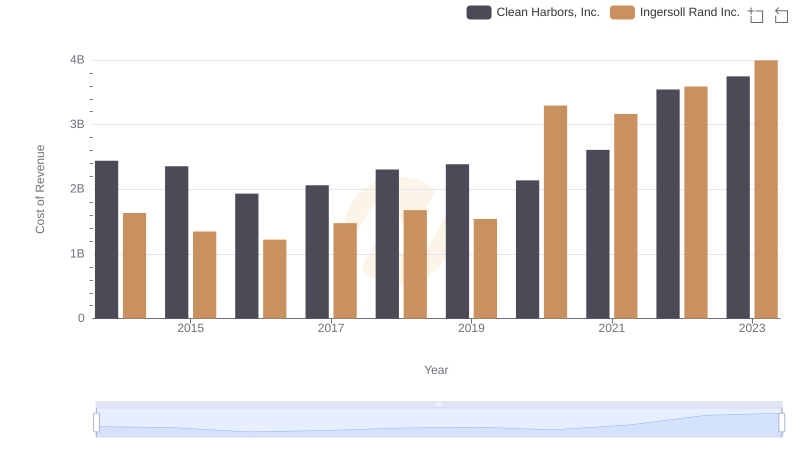
Cost of Revenue: Key Insights for Ingersoll Rand Inc. and Clean Harbors, Inc.
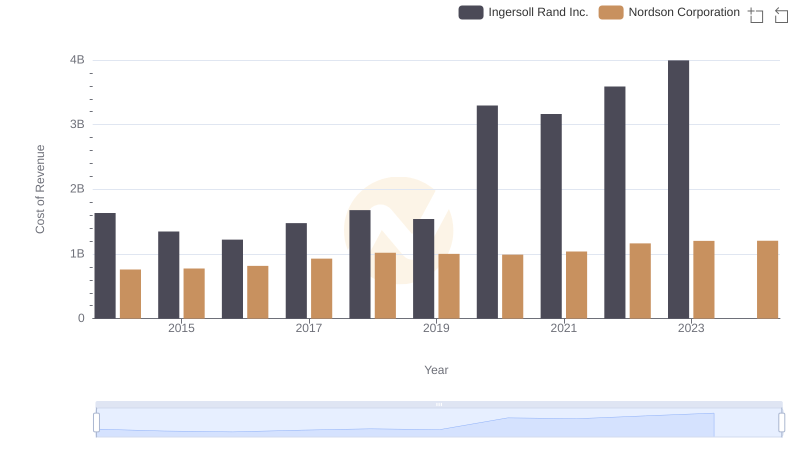
Cost of Revenue Comparison: Ingersoll Rand Inc. vs Nordson Corporation
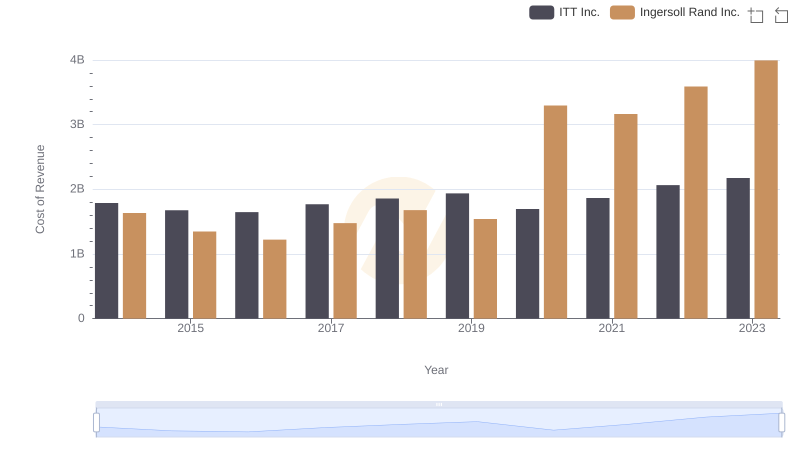
Ingersoll Rand Inc. vs ITT Inc.: Efficiency in Cost of Revenue Explored
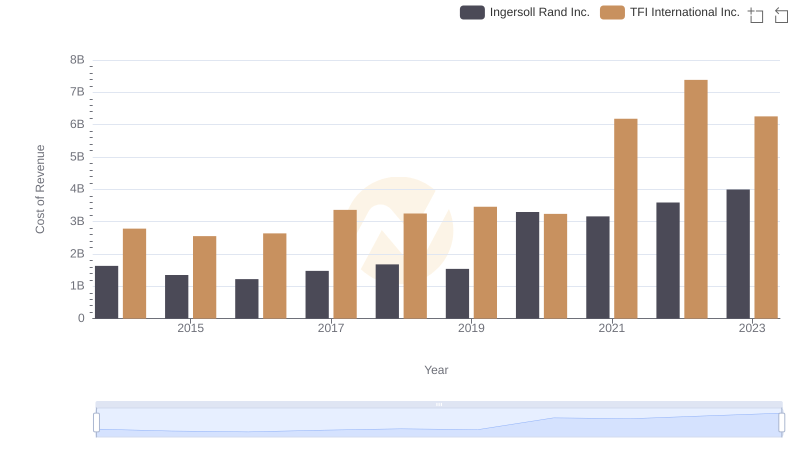
Cost of Revenue: Key Insights for Ingersoll Rand Inc. and TFI International Inc.
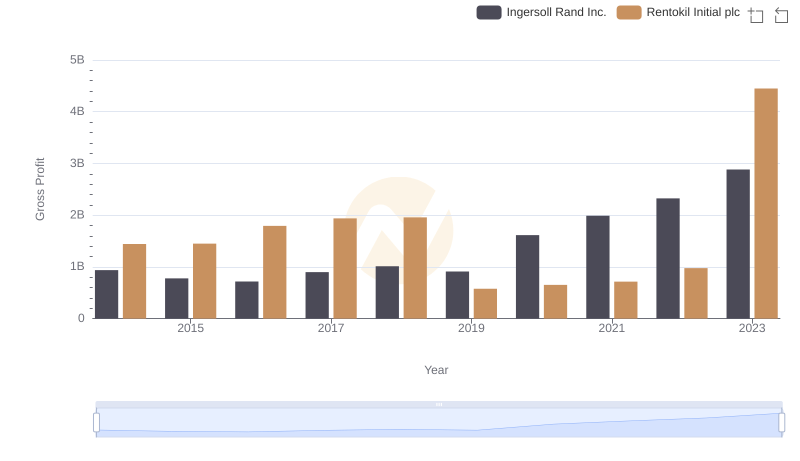
Gross Profit Comparison: Ingersoll Rand Inc. and Rentokil Initial plc Trends
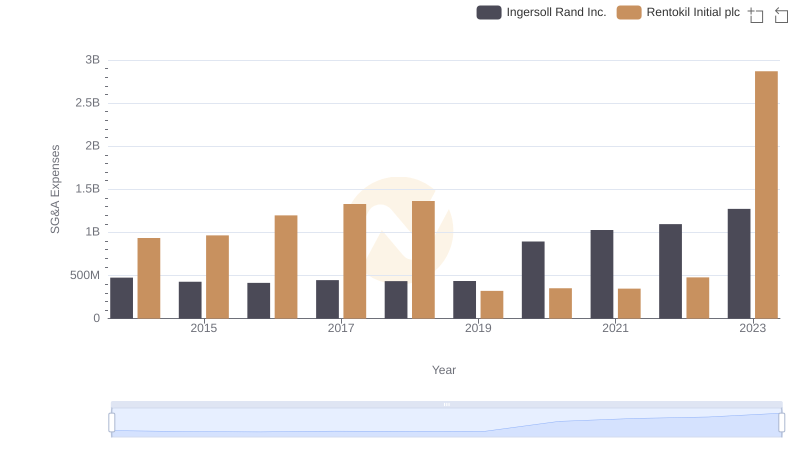
Ingersoll Rand Inc. and Rentokil Initial plc: SG&A Spending Patterns Compared