| __timestamp | Global Payments Inc. | XPO Logistics, Inc. |
|---|---|---|
| Wednesday, January 1, 2014 | 594102000 | 56600000 |
| Thursday, January 1, 2015 | 618109000 | 298000000 |
| Friday, January 1, 2016 | 748136000 | 1108300000 |
| Sunday, January 1, 2017 | 1010019000 | 1196700000 |
| Monday, January 1, 2018 | 1315968000 | 1488000000 |
| Tuesday, January 1, 2019 | 1764994000 | 1594000000 |
| Wednesday, January 1, 2020 | 2508393000 | 727000000 |
| Friday, January 1, 2021 | 3233589000 | 741000000 |
| Saturday, January 1, 2022 | 2427684000 | 941000000 |
| Sunday, January 1, 2023 | 3606789000 | 860000000 |
| Monday, January 1, 2024 | 2333605000 | 1186000000 |
Igniting the spark of knowledge
In the ever-evolving landscape of financial services and logistics, Global Payments Inc. and XPO Logistics, Inc. have demonstrated remarkable EBITDA growth over the past decade. From 2014 to 2023, Global Payments Inc. has seen its EBITDA surge by over 530%, reflecting its strategic expansions and technological advancements. Meanwhile, XPO Logistics, Inc. has experienced a robust 1,420% increase, underscoring its aggressive growth strategy and market penetration.
This comparison highlights the dynamic nature of these industries and the strategic maneuvers that have propelled these companies to new heights. As we look to the future, the question remains: which company will continue to lead in EBITDA growth?
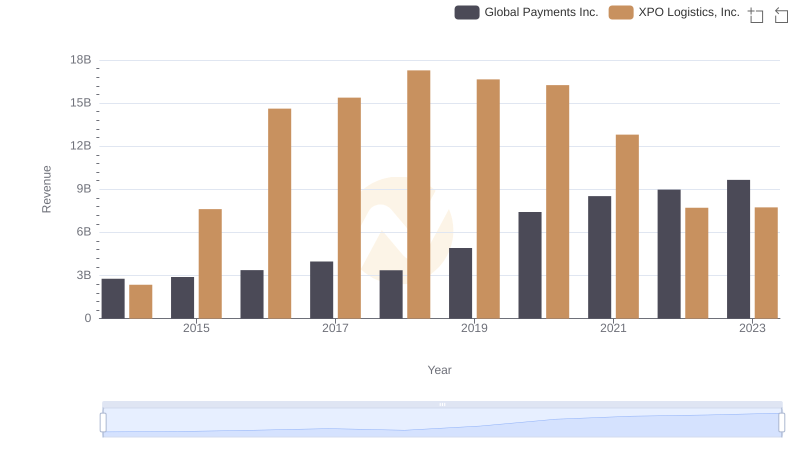
Breaking Down Revenue Trends: Global Payments Inc. vs XPO Logistics, Inc.
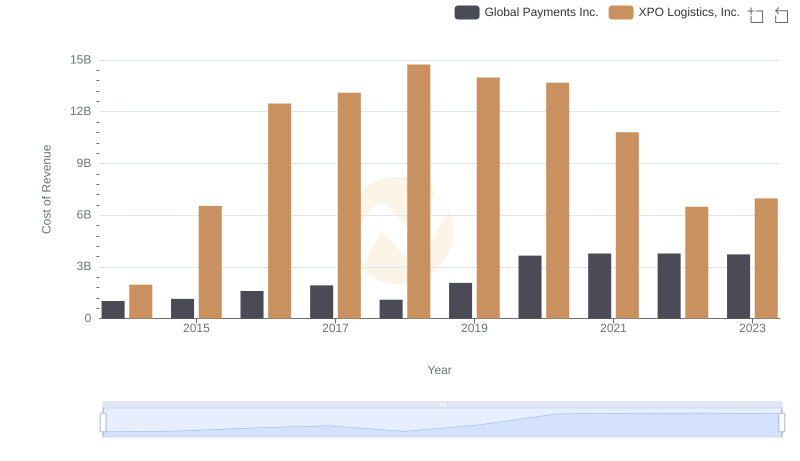
Cost of Revenue Comparison: Global Payments Inc. vs XPO Logistics, Inc.
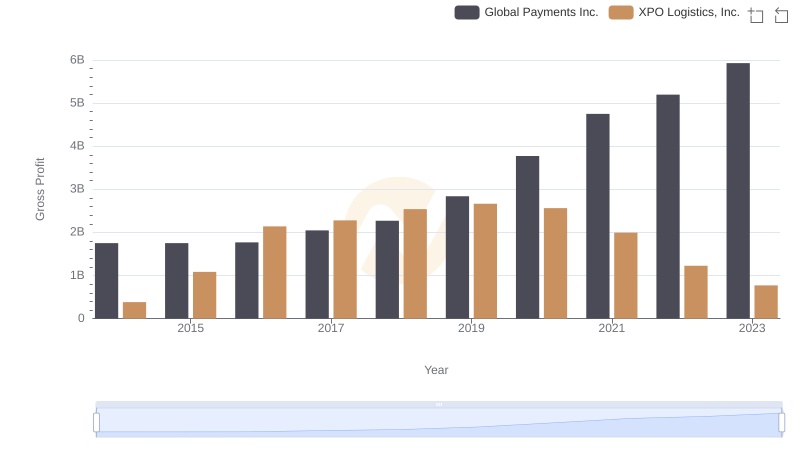
Gross Profit Analysis: Comparing Global Payments Inc. and XPO Logistics, Inc.
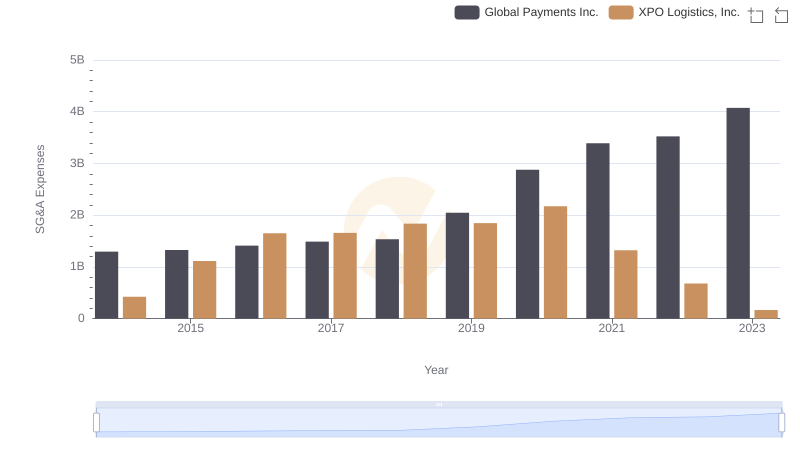
SG&A Efficiency Analysis: Comparing Global Payments Inc. and XPO Logistics, Inc.
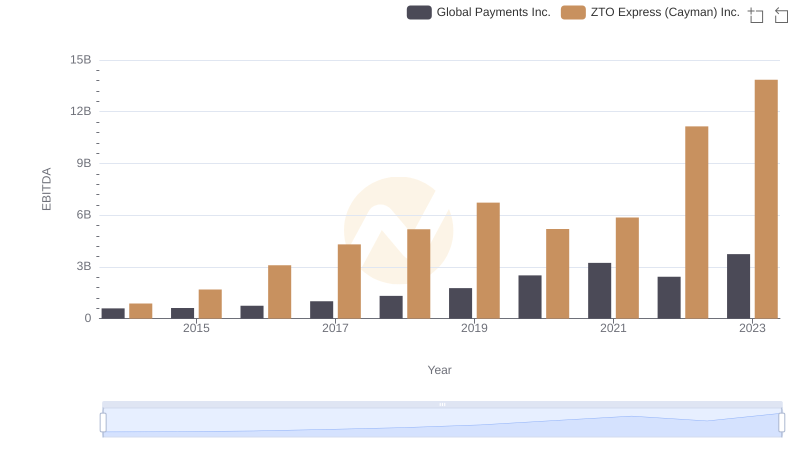
Global Payments Inc. and ZTO Express (Cayman) Inc.: A Detailed Examination of EBITDA Performance
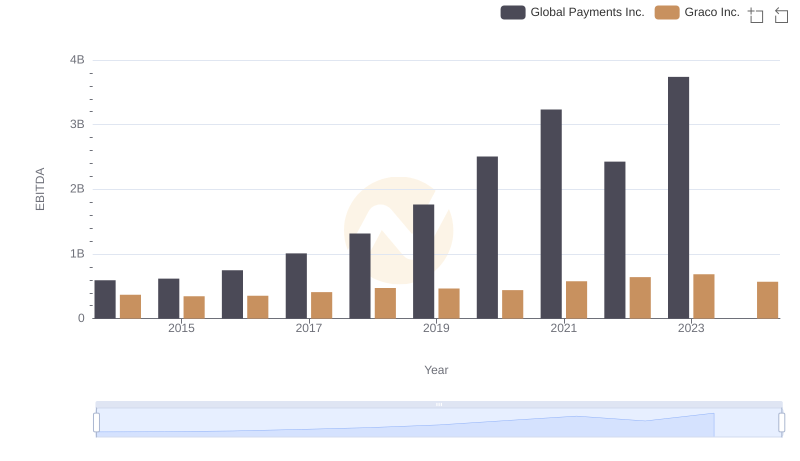
A Side-by-Side Analysis of EBITDA: Global Payments Inc. and Graco Inc.
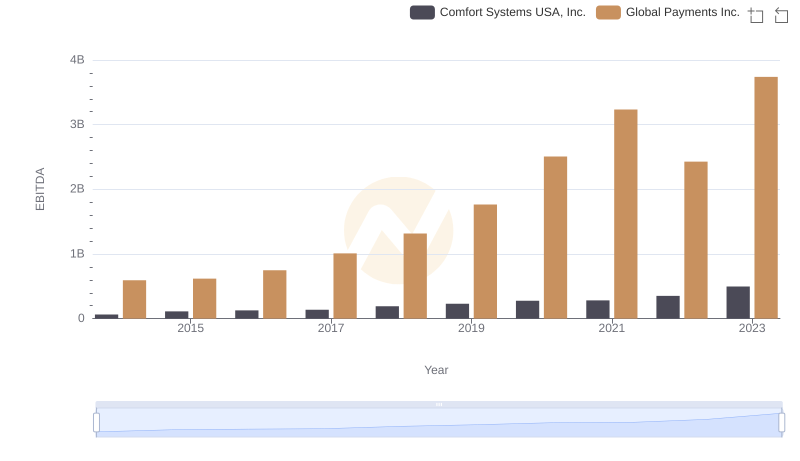
A Side-by-Side Analysis of EBITDA: Global Payments Inc. and Comfort Systems USA, Inc.
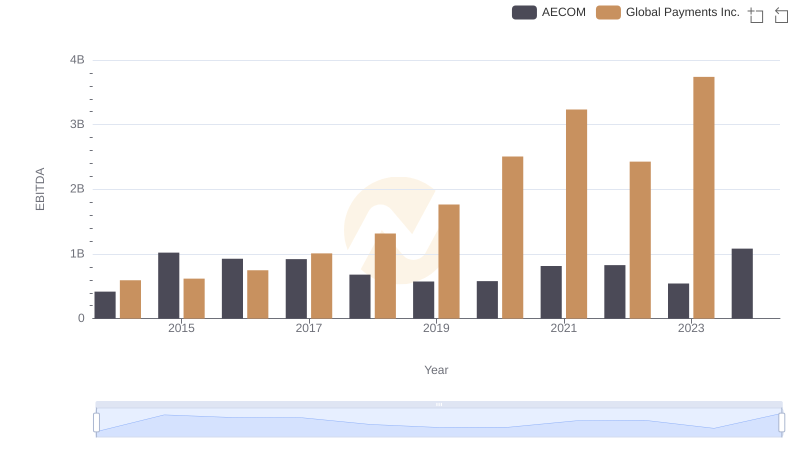
A Professional Review of EBITDA: Global Payments Inc. Compared to AECOM
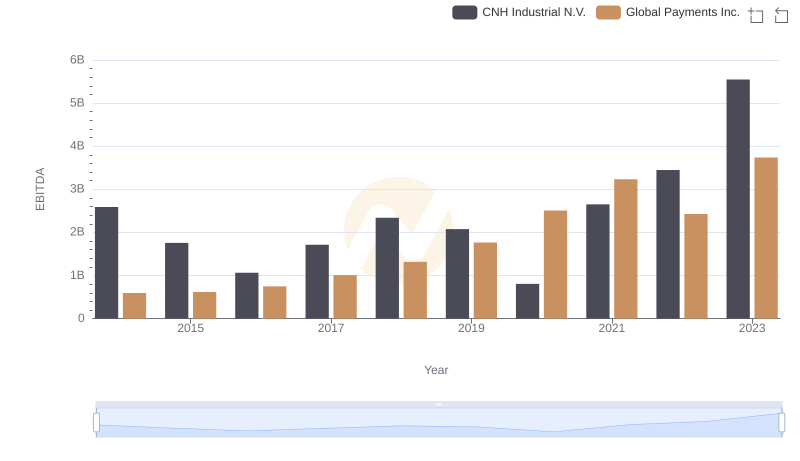
A Side-by-Side Analysis of EBITDA: Global Payments Inc. and CNH Industrial N.V.
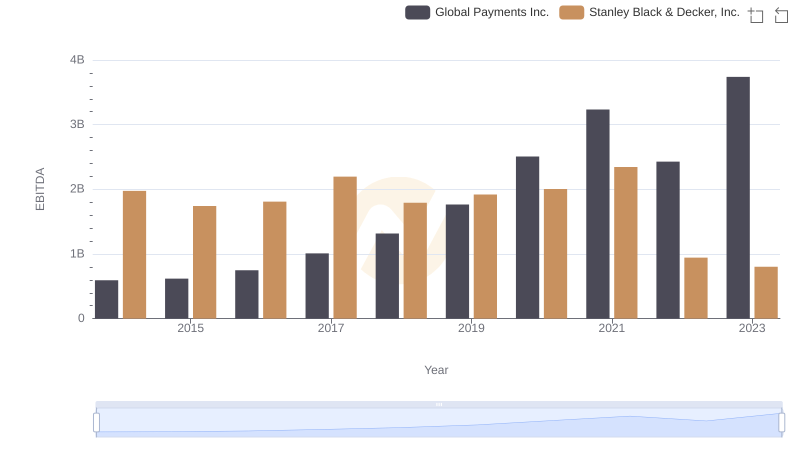
Comprehensive EBITDA Comparison: Global Payments Inc. vs Stanley Black & Decker, Inc.