| __timestamp | Global Payments Inc. | XPO Logistics, Inc. |
|---|---|---|
| Wednesday, January 1, 2014 | 1751611000 | 381600000 |
| Thursday, January 1, 2015 | 1750511000 | 1084800000 |
| Friday, January 1, 2016 | 1767444000 | 2139300000 |
| Sunday, January 1, 2017 | 2047126000 | 2279700000 |
| Monday, January 1, 2018 | 2271352000 | 2541000000 |
| Tuesday, January 1, 2019 | 2838089000 | 2666000000 |
| Wednesday, January 1, 2020 | 3772831000 | 2563000000 |
| Friday, January 1, 2021 | 4750037000 | 1994000000 |
| Saturday, January 1, 2022 | 5196898000 | 1227000000 |
| Sunday, January 1, 2023 | 5926898000 | 770000000 |
| Monday, January 1, 2024 | 6345778000 | 915000000 |
Infusing magic into the data realm
In the ever-evolving landscape of the logistics and payments industries, Global Payments Inc. and XPO Logistics, Inc. have showcased intriguing trajectories in their gross profit over the past decade. From 2014 to 2023, Global Payments Inc. has seen a remarkable growth of approximately 238%, starting from $1.75 billion and reaching nearly $5.93 billion. This growth underscores the company's strategic expansions and technological advancements in the digital payments sector.
Conversely, XPO Logistics, Inc. experienced a more volatile journey. While their gross profit peaked in 2019 at around $2.67 billion, it has since declined by about 71% to $770 million in 2023. This decline may reflect the challenges faced in the logistics sector, including supply chain disruptions and market competition.
These contrasting trends highlight the dynamic nature of these industries and the importance of strategic adaptability in maintaining financial growth.
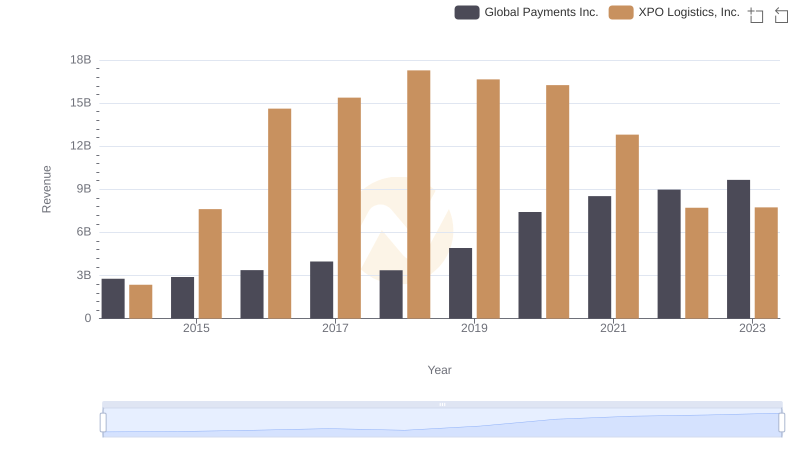
Breaking Down Revenue Trends: Global Payments Inc. vs XPO Logistics, Inc.
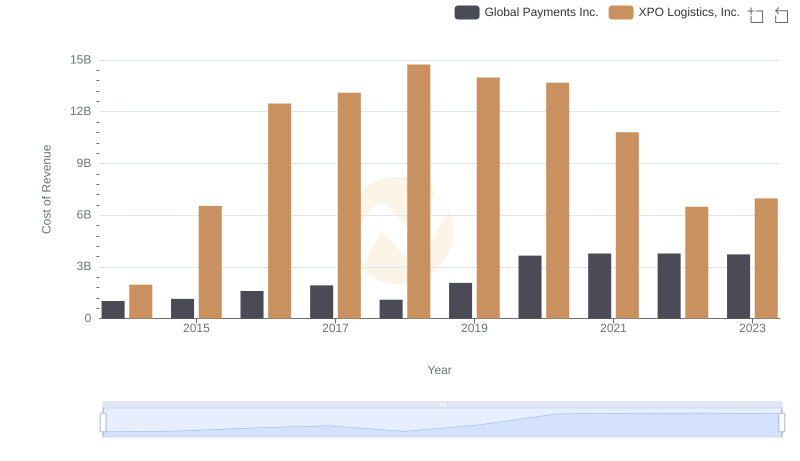
Cost of Revenue Comparison: Global Payments Inc. vs XPO Logistics, Inc.
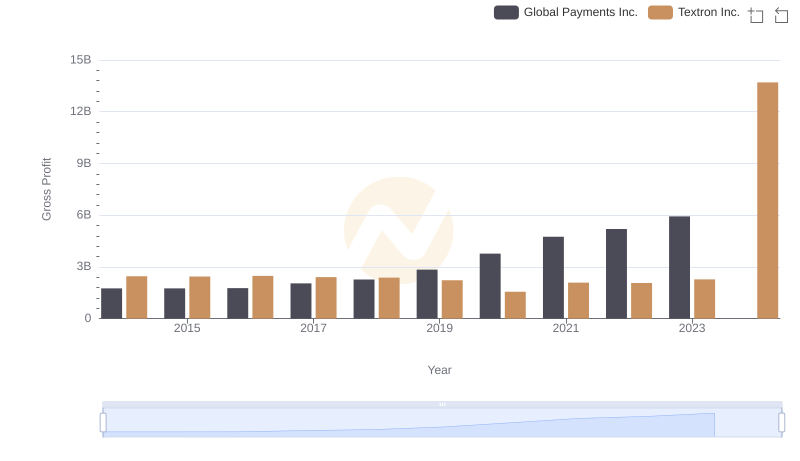
Key Insights on Gross Profit: Global Payments Inc. vs Textron Inc.
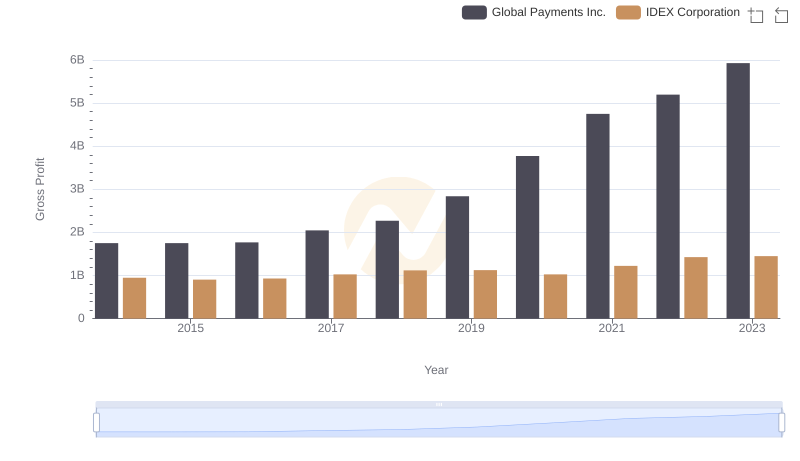
Gross Profit Comparison: Global Payments Inc. and IDEX Corporation Trends
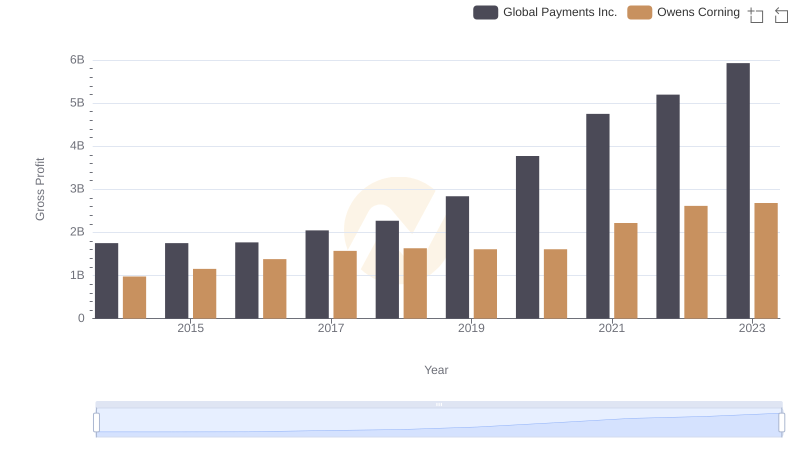
Global Payments Inc. and Owens Corning: A Detailed Gross Profit Analysis
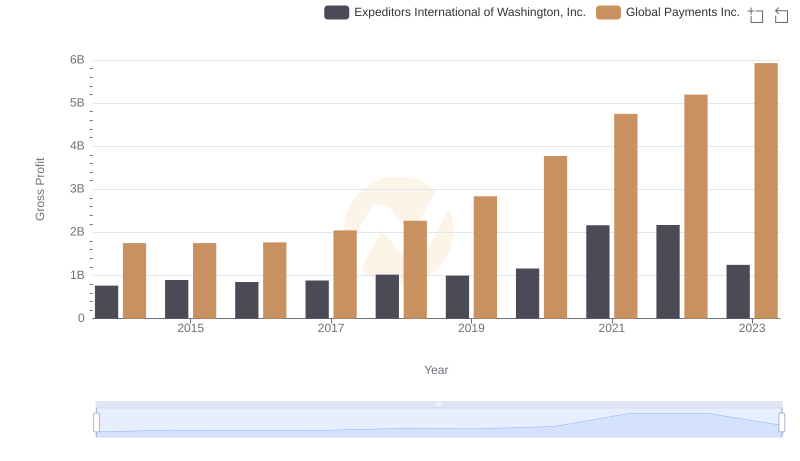
Gross Profit Trends Compared: Global Payments Inc. vs Expeditors International of Washington, Inc.
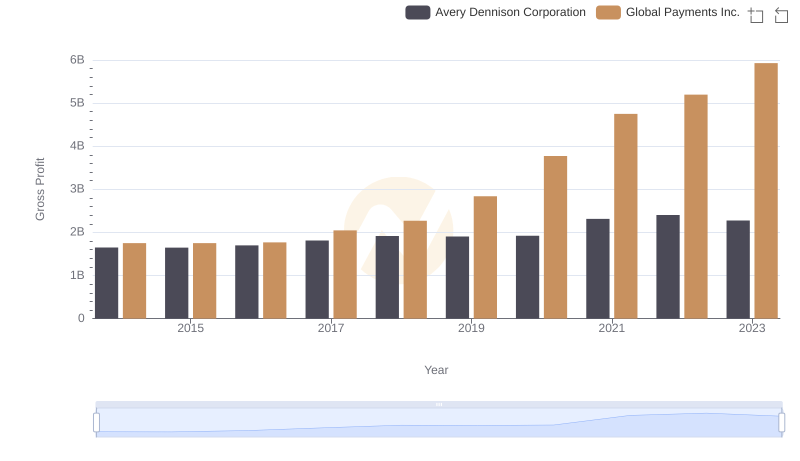
Global Payments Inc. vs Avery Dennison Corporation: A Gross Profit Performance Breakdown
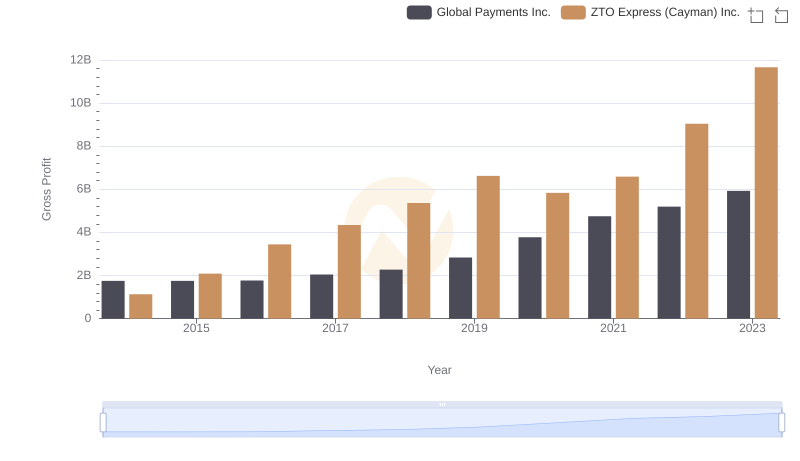
Global Payments Inc. vs ZTO Express (Cayman) Inc.: A Gross Profit Performance Breakdown
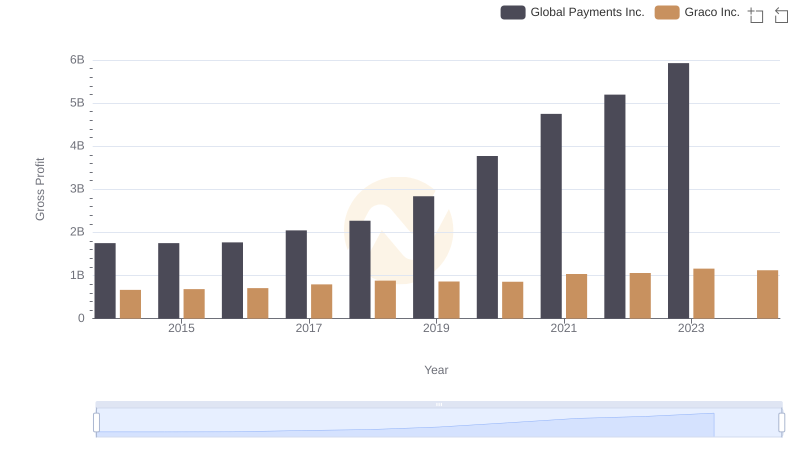
Gross Profit Comparison: Global Payments Inc. and Graco Inc. Trends
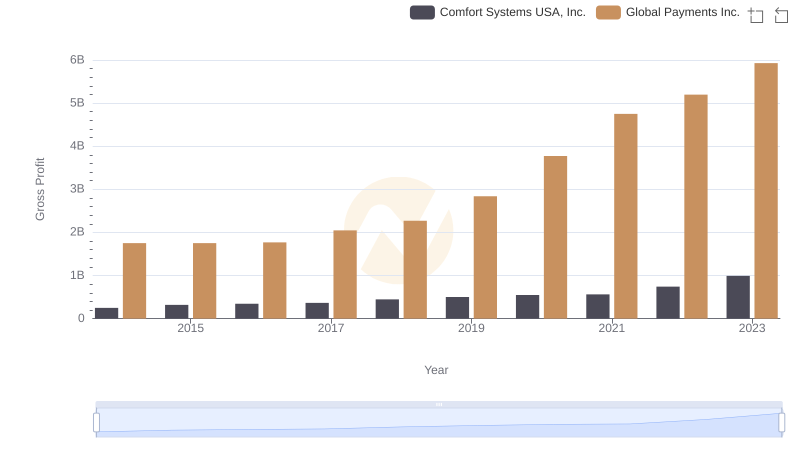
Who Generates Higher Gross Profit? Global Payments Inc. or Comfort Systems USA, Inc.
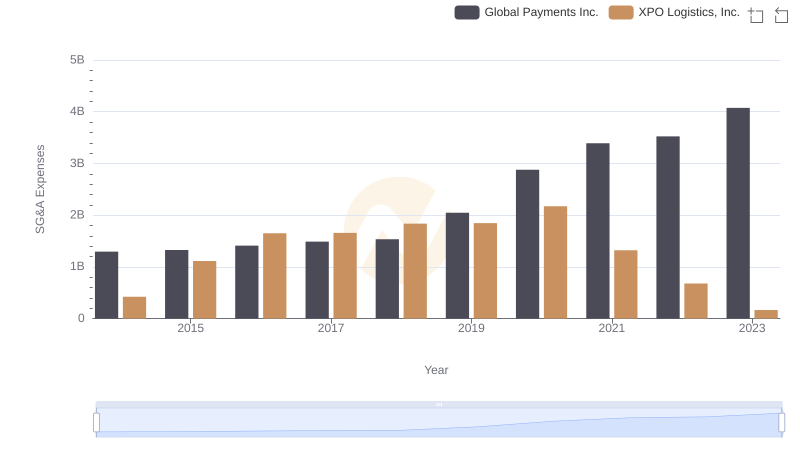
SG&A Efficiency Analysis: Comparing Global Payments Inc. and XPO Logistics, Inc.

Comprehensive EBITDA Comparison: Global Payments Inc. vs XPO Logistics, Inc.