| __timestamp | CNH Industrial N.V. | Global Payments Inc. |
|---|---|---|
| Wednesday, January 1, 2014 | 25534000000 | 1022107000 |
| Thursday, January 1, 2015 | 20357000000 | 1147639000 |
| Friday, January 1, 2016 | 19539000000 | 1603532000 |
| Sunday, January 1, 2017 | 21621000000 | 1928037000 |
| Monday, January 1, 2018 | 22958000000 | 1095014000 |
| Tuesday, January 1, 2019 | 21832000000 | 2073803000 |
| Wednesday, January 1, 2020 | 21327000000 | 3650727000 |
| Friday, January 1, 2021 | 25951000000 | 3773725000 |
| Saturday, January 1, 2022 | 16797000000 | 3778617000 |
| Sunday, January 1, 2023 | 16805000000 | 3727521000 |
| Monday, January 1, 2024 | 3760116000 |
Igniting the spark of knowledge
In the ever-evolving landscape of global commerce, understanding the cost of revenue is crucial for evaluating a company's financial health. This comparison between Global Payments Inc. and CNH Industrial N.V. offers a fascinating glimpse into their financial journeys from 2014 to 2023.
Over the past decade, CNH Industrial N.V. has consistently maintained a higher cost of revenue compared to Global Payments Inc. In 2014, CNH's cost of revenue was approximately 25 times that of Global Payments. However, by 2023, Global Payments had significantly narrowed this gap, with its cost of revenue growing by over 260%.
While CNH Industrial N.V. experienced a 34% decrease in cost of revenue from its peak in 2014, Global Payments Inc. saw a steady upward trend, reflecting its expanding market presence. This data underscores the dynamic nature of the global financial landscape, where strategic decisions and market conditions continuously reshape company trajectories.
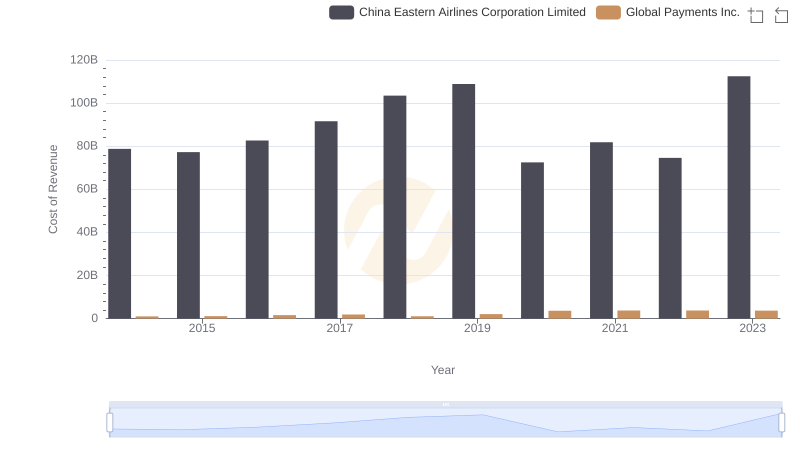
Cost of Revenue Trends: Global Payments Inc. vs China Eastern Airlines Corporation Limited
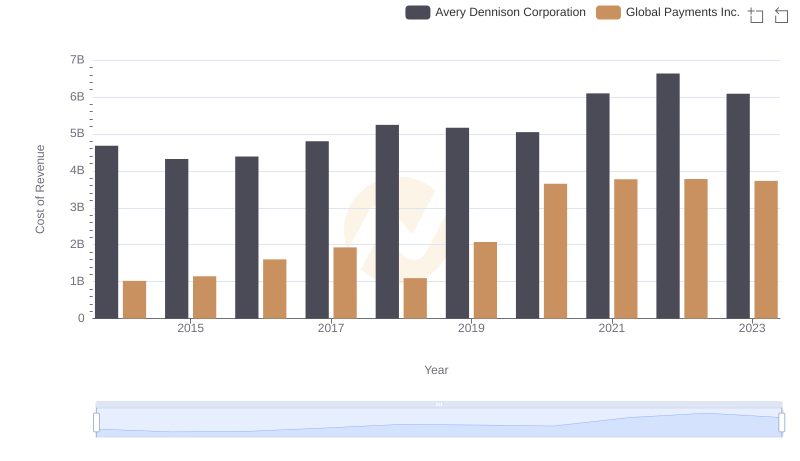
Cost of Revenue Comparison: Global Payments Inc. vs Avery Dennison Corporation
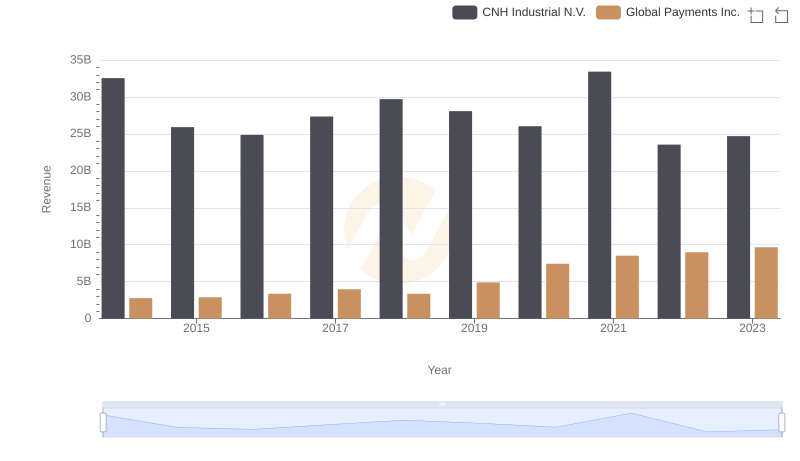
Revenue Insights: Global Payments Inc. and CNH Industrial N.V. Performance Compared
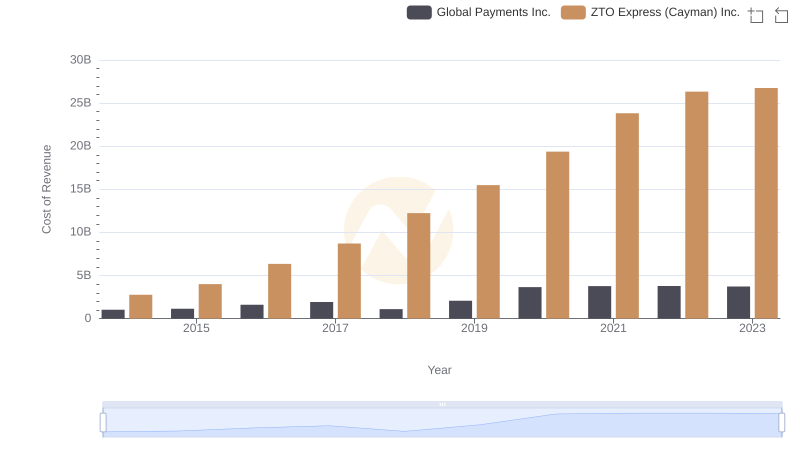
Analyzing Cost of Revenue: Global Payments Inc. and ZTO Express (Cayman) Inc.
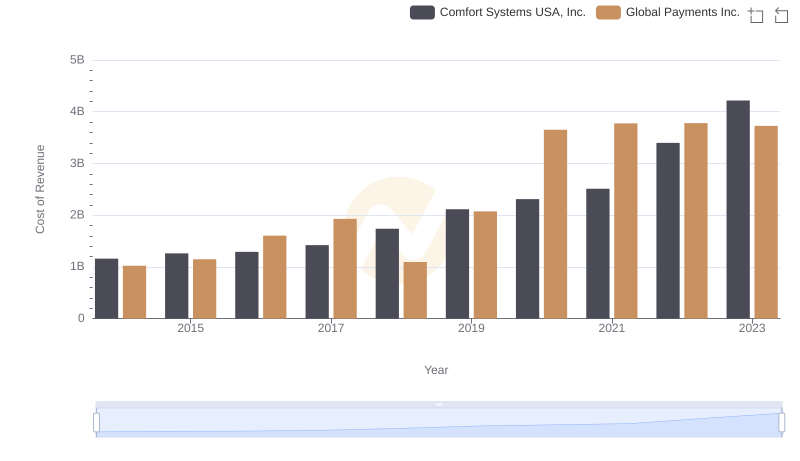
Comparing Cost of Revenue Efficiency: Global Payments Inc. vs Comfort Systems USA, Inc.

Comparing Cost of Revenue Efficiency: Global Payments Inc. vs AECOM
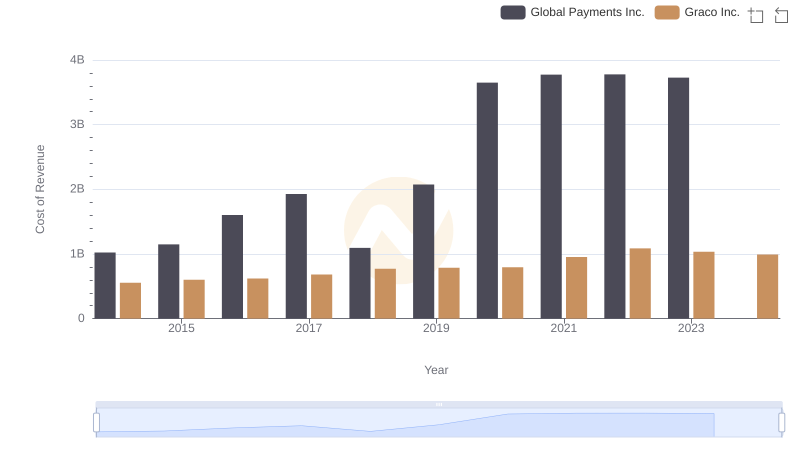
Analyzing Cost of Revenue: Global Payments Inc. and Graco Inc.
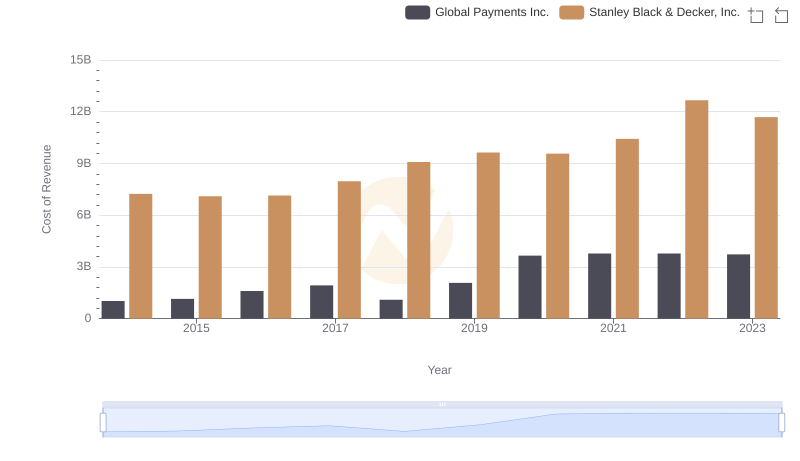
Cost of Revenue Trends: Global Payments Inc. vs Stanley Black & Decker, Inc.
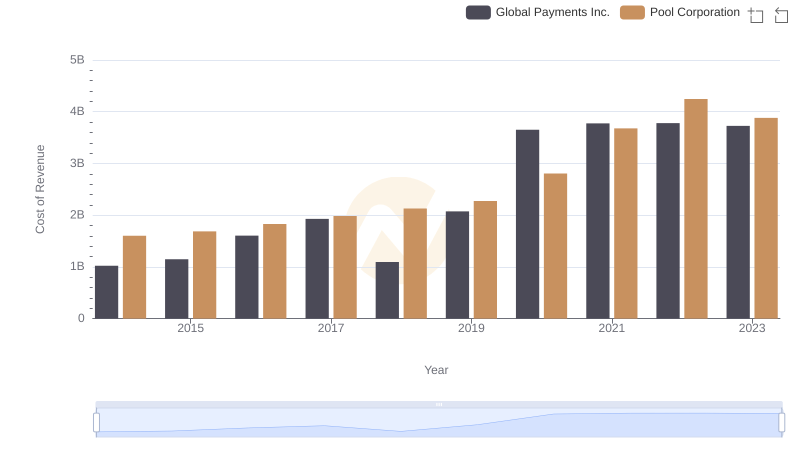
Global Payments Inc. vs Pool Corporation: Efficiency in Cost of Revenue Explored
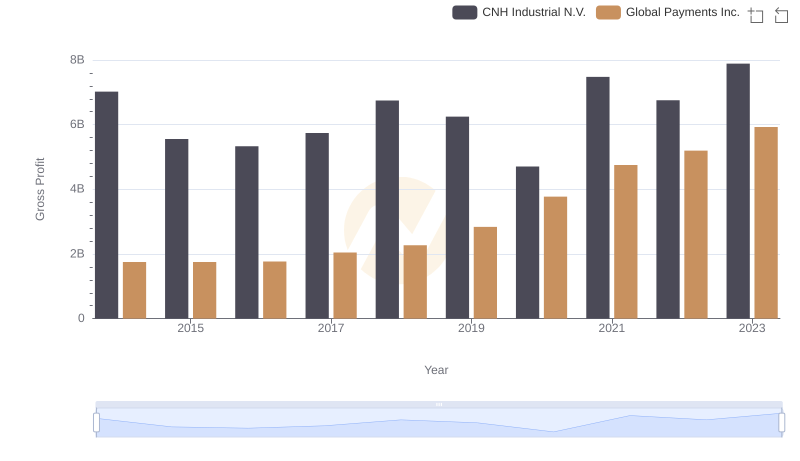
Key Insights on Gross Profit: Global Payments Inc. vs CNH Industrial N.V.
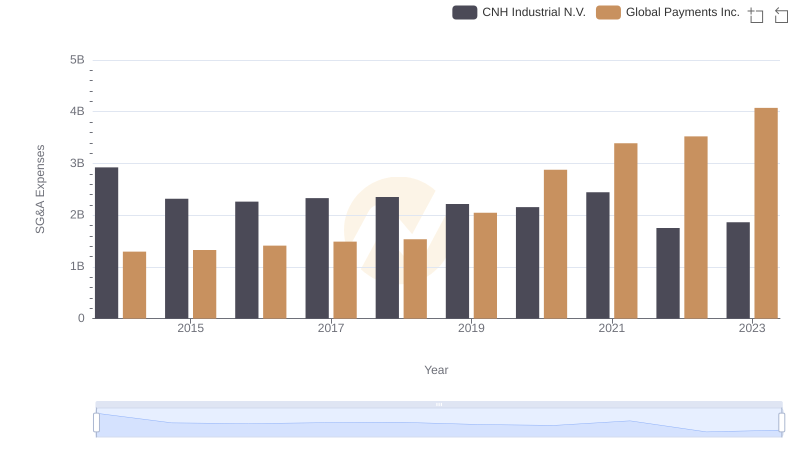
Global Payments Inc. or CNH Industrial N.V.: Who Manages SG&A Costs Better?
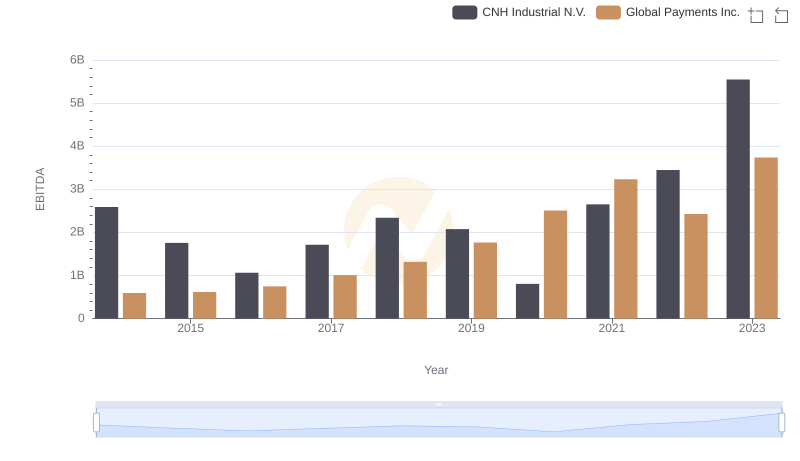
A Side-by-Side Analysis of EBITDA: Global Payments Inc. and CNH Industrial N.V.