| __timestamp | Cisco Systems, Inc. | Teledyne Technologies Incorporated |
|---|---|---|
| Wednesday, January 1, 2014 | 11437000000 | 612400000 |
| Thursday, January 1, 2015 | 11861000000 | 588600000 |
| Friday, January 1, 2016 | 11433000000 | 574100000 |
| Sunday, January 1, 2017 | 11177000000 | 656000000 |
| Monday, January 1, 2018 | 11386000000 | 694200000 |
| Tuesday, January 1, 2019 | 11398000000 | 751600000 |
| Wednesday, January 1, 2020 | 11094000000 | 700800000 |
| Friday, January 1, 2021 | 11411000000 | 1067800000 |
| Saturday, January 1, 2022 | 11186000000 | 1156600000 |
| Sunday, January 1, 2023 | 12358000000 | 1208300000 |
| Monday, January 1, 2024 | 13177000000 |
Infusing magic into the data realm
In the ever-evolving tech landscape, operational efficiency is paramount. This analysis delves into the Selling, General, and Administrative (SG&A) expenses of two industry giants: Cisco Systems, Inc. and Teledyne Technologies Incorporated, from 2014 to 2023. Cisco, a leader in networking solutions, consistently reported SG&A expenses averaging around $11.6 billion annually, with a notable increase of 10% in 2023. In contrast, Teledyne, a diversified technology company, maintained a more modest average of $801 million, reflecting a steady growth trajectory with a 110% increase from 2014 to 2023. The data highlights Cisco's significant investment in operational costs, potentially indicating a focus on expansive growth and market dominance. Meanwhile, Teledyne's leaner approach suggests strategic efficiency. Notably, 2024 data for Teledyne is missing, leaving room for speculation on future trends. This comparative insight underscores the diverse strategies employed by tech leaders in managing operational costs.
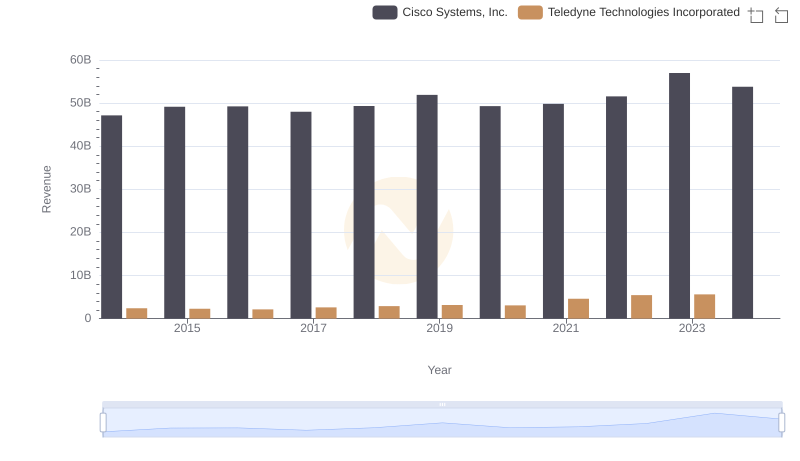
Cisco Systems, Inc. vs Teledyne Technologies Incorporated: Examining Key Revenue Metrics
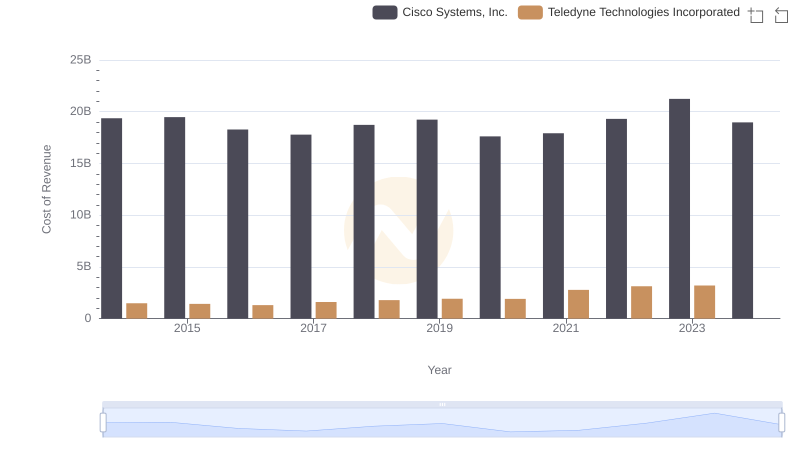
Cost of Revenue Comparison: Cisco Systems, Inc. vs Teledyne Technologies Incorporated
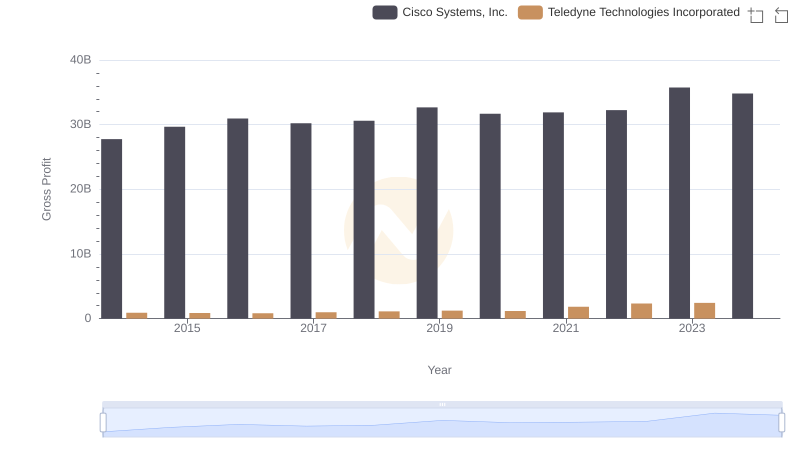
Gross Profit Trends Compared: Cisco Systems, Inc. vs Teledyne Technologies Incorporated
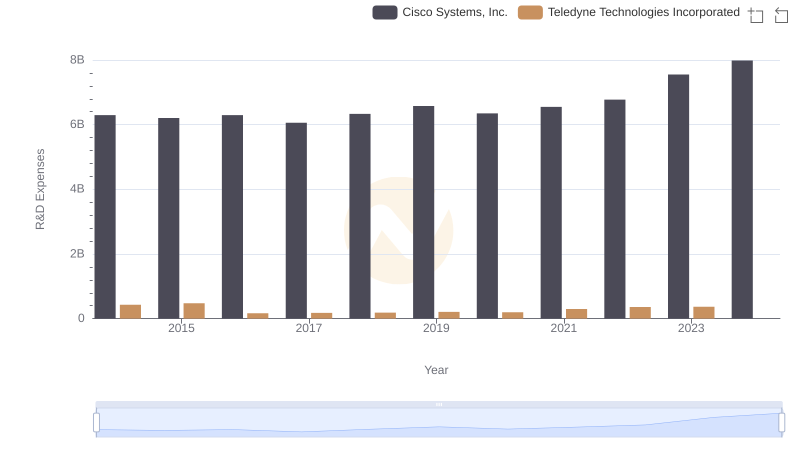
Who Prioritizes Innovation? R&D Spending Compared for Cisco Systems, Inc. and Teledyne Technologies Incorporated
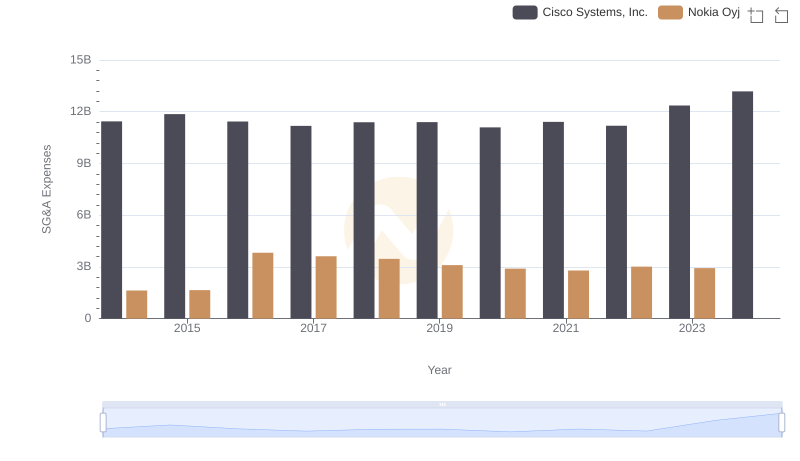
Cisco Systems, Inc. or Nokia Oyj: Who Manages SG&A Costs Better?
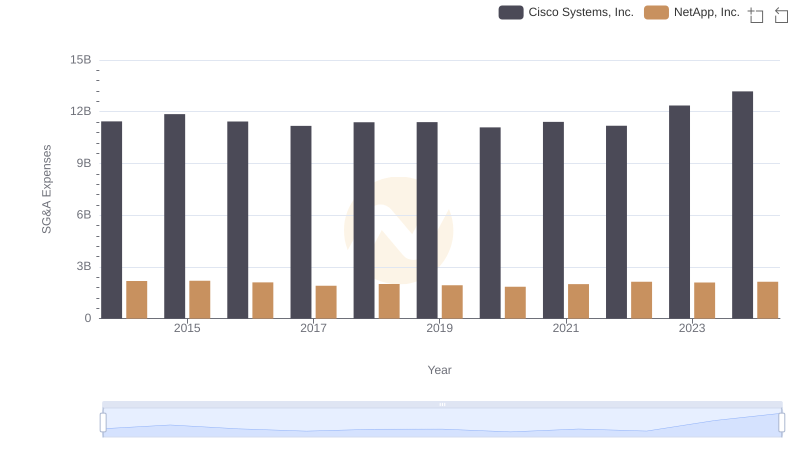
Cost Management Insights: SG&A Expenses for Cisco Systems, Inc. and NetApp, Inc.
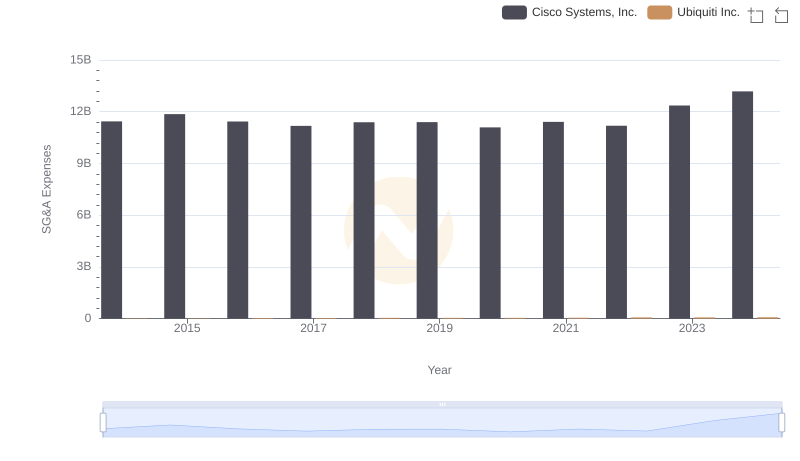
Cisco Systems, Inc. vs Ubiquiti Inc.: SG&A Expense Trends
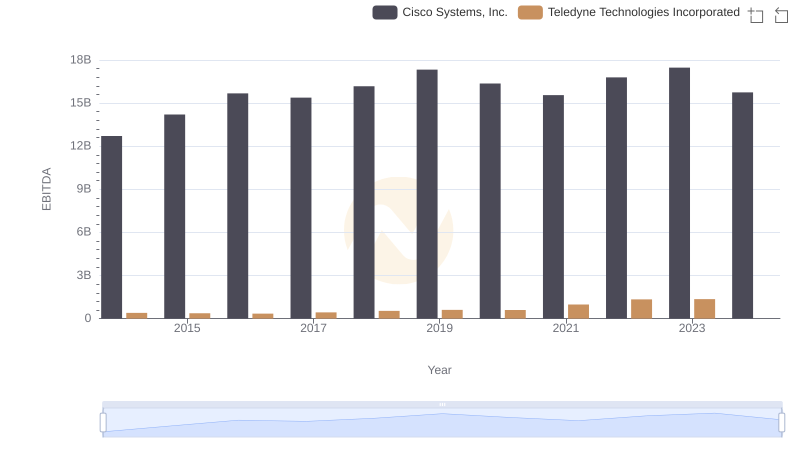
Cisco Systems, Inc. and Teledyne Technologies Incorporated: A Detailed Examination of EBITDA Performance
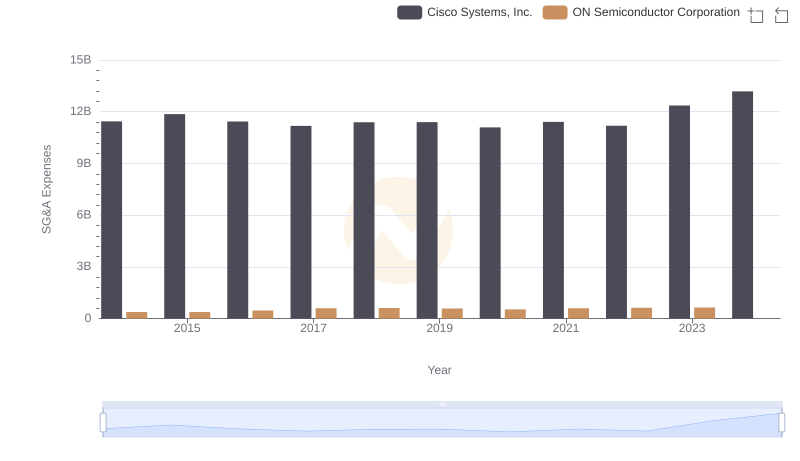
Selling, General, and Administrative Costs: Cisco Systems, Inc. vs ON Semiconductor Corporation
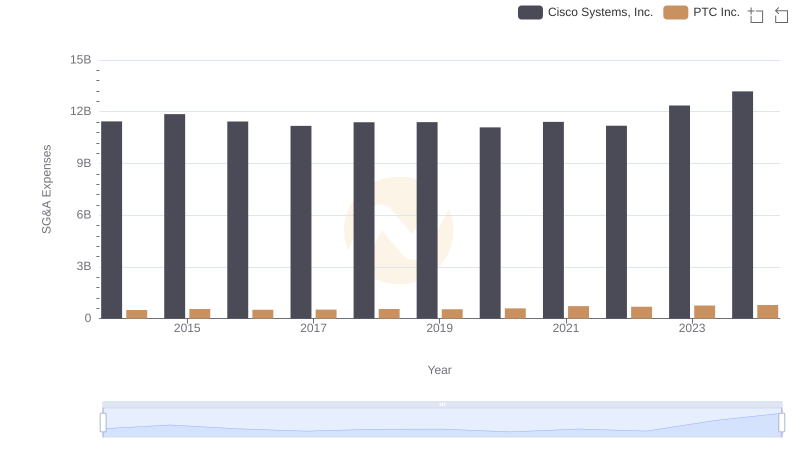
Cisco Systems, Inc. vs PTC Inc.: SG&A Expense Trends

Cisco Systems, Inc. vs FLEETCOR Technologies, Inc.: SG&A Expense Trends
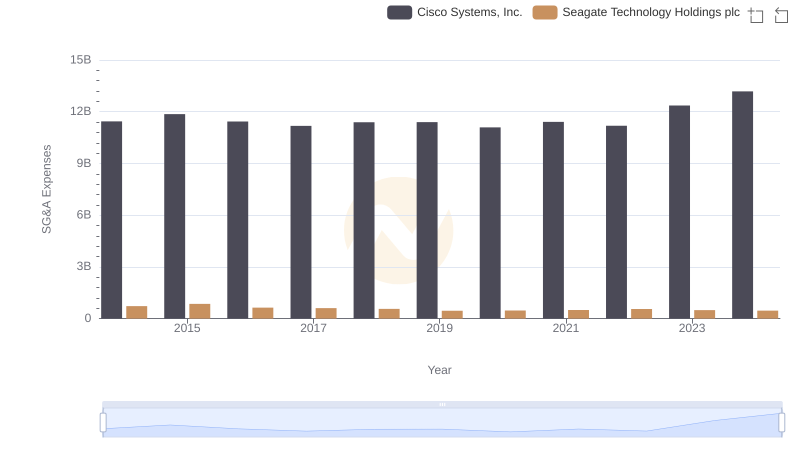
SG&A Efficiency Analysis: Comparing Cisco Systems, Inc. and Seagate Technology Holdings plc