| __timestamp | Cisco Systems, Inc. | Teledyne Technologies Incorporated |
|---|---|---|
| Wednesday, January 1, 2014 | 12709000000 | 395400000 |
| Thursday, January 1, 2015 | 14209000000 | 372500000 |
| Friday, January 1, 2016 | 15678000000 | 351700000 |
| Sunday, January 1, 2017 | 15383000000 | 436800000 |
| Monday, January 1, 2018 | 16172000000 | 540100000 |
| Tuesday, January 1, 2019 | 17334000000 | 610800000 |
| Wednesday, January 1, 2020 | 16363000000 | 604100000 |
| Friday, January 1, 2021 | 15558000000 | 982000000 |
| Saturday, January 1, 2022 | 16794000000 | 1335200000 |
| Sunday, January 1, 2023 | 17471000000 | 1360800000 |
| Monday, January 1, 2024 | 15747000000 |
In pursuit of knowledge
In the ever-evolving landscape of technology and innovation, Cisco Systems, Inc. and Teledyne Technologies Incorporated stand as titans of industry. Over the past decade, Cisco has demonstrated a robust EBITDA growth, increasing by approximately 38% from 2014 to 2023. This growth underscores Cisco's strategic prowess in adapting to market demands and technological advancements. In contrast, Teledyne's EBITDA has surged by an impressive 244% during the same period, reflecting its dynamic expansion and diversification strategies.
While Cisco's EBITDA peaked in 2023, Teledyne's growth trajectory shows a consistent upward trend, with a notable leap in 2022. However, data for 2024 remains incomplete, leaving room for speculation on future performance. This analysis not only highlights the financial health of these companies but also offers insights into their strategic directions in a competitive market.
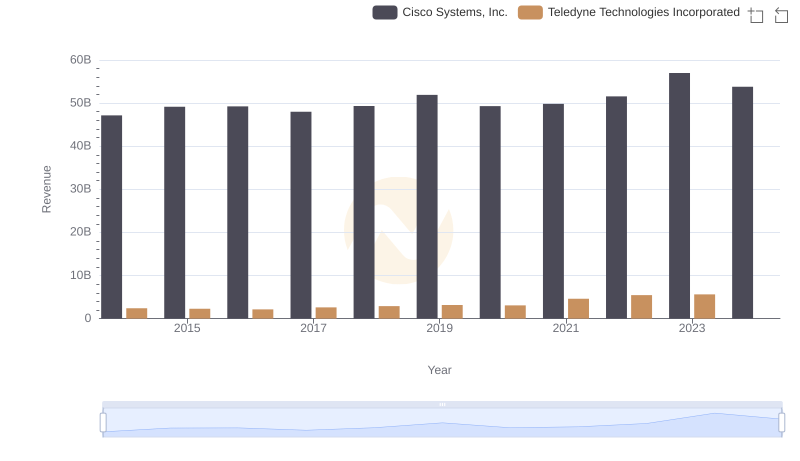
Cisco Systems, Inc. vs Teledyne Technologies Incorporated: Examining Key Revenue Metrics
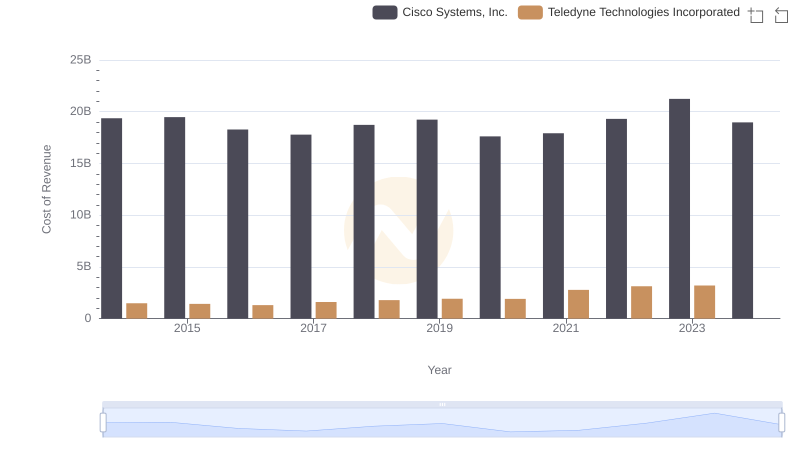
Cost of Revenue Comparison: Cisco Systems, Inc. vs Teledyne Technologies Incorporated
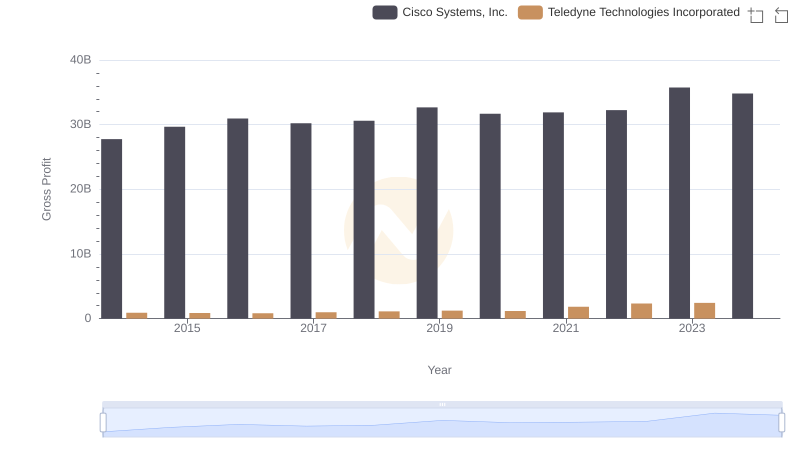
Gross Profit Trends Compared: Cisco Systems, Inc. vs Teledyne Technologies Incorporated
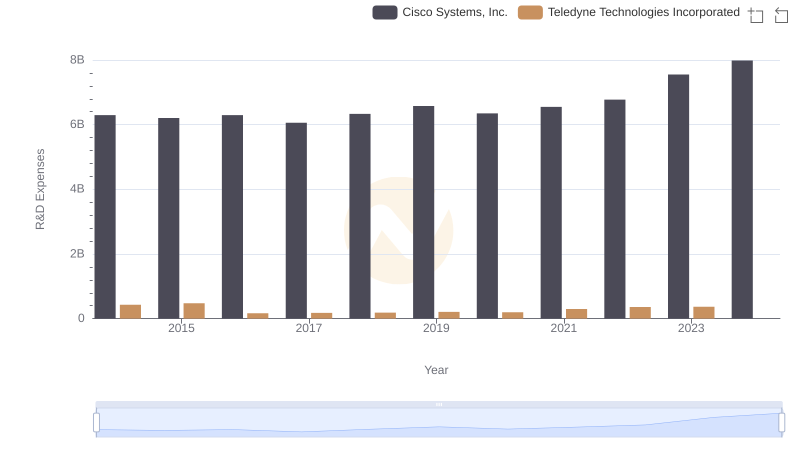
Who Prioritizes Innovation? R&D Spending Compared for Cisco Systems, Inc. and Teledyne Technologies Incorporated
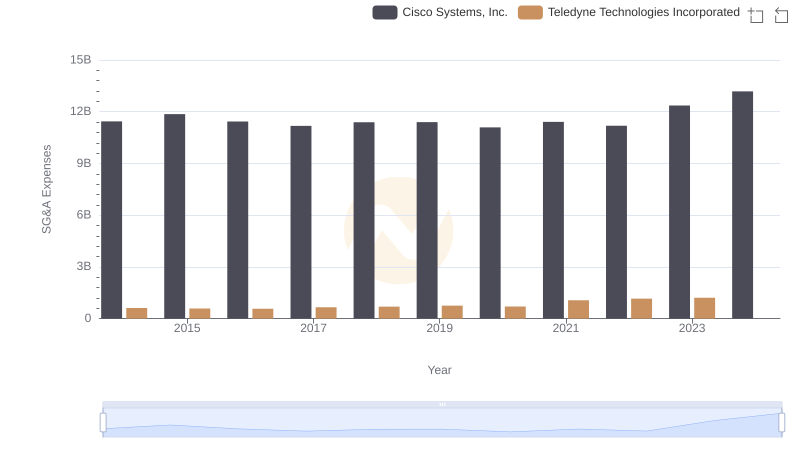
Operational Costs Compared: SG&A Analysis of Cisco Systems, Inc. and Teledyne Technologies Incorporated
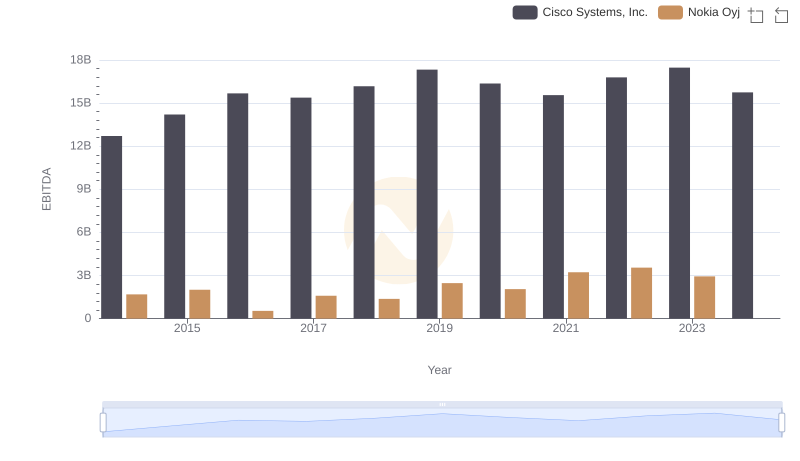
Professional EBITDA Benchmarking: Cisco Systems, Inc. vs Nokia Oyj

A Side-by-Side Analysis of EBITDA: Cisco Systems, Inc. and NetApp, Inc.
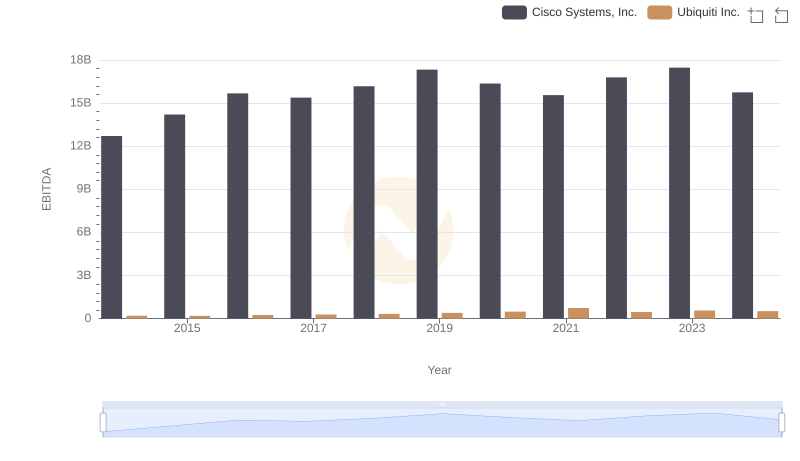
Comprehensive EBITDA Comparison: Cisco Systems, Inc. vs Ubiquiti Inc.

Professional EBITDA Benchmarking: Cisco Systems, Inc. vs ON Semiconductor Corporation
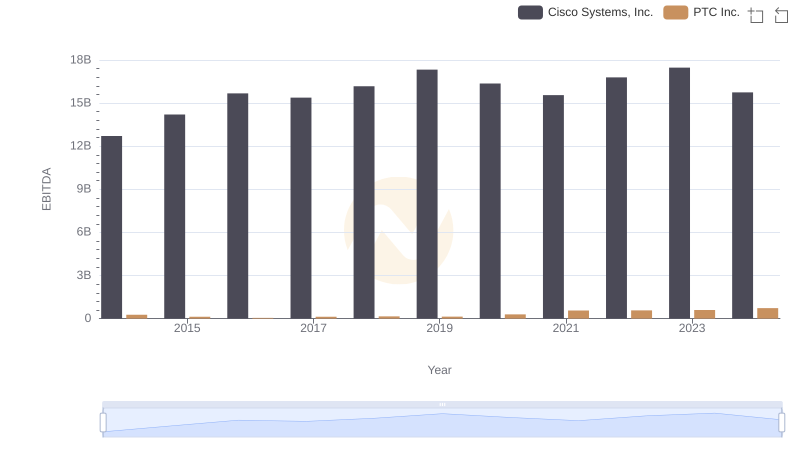
A Professional Review of EBITDA: Cisco Systems, Inc. Compared to PTC Inc.
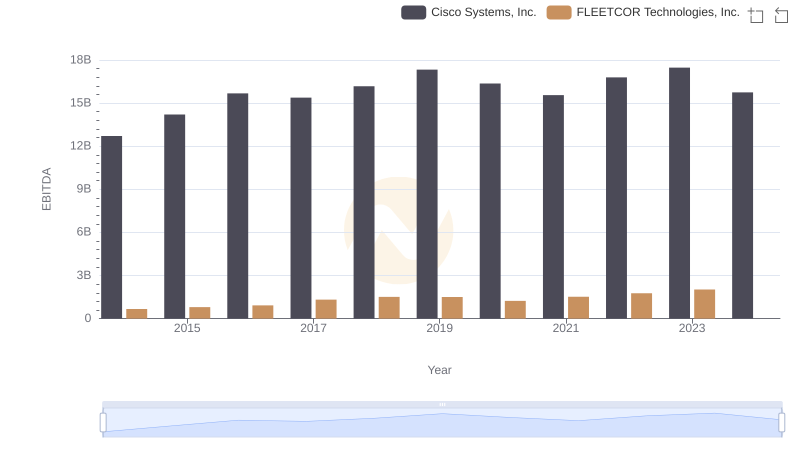
EBITDA Metrics Evaluated: Cisco Systems, Inc. vs FLEETCOR Technologies, Inc.
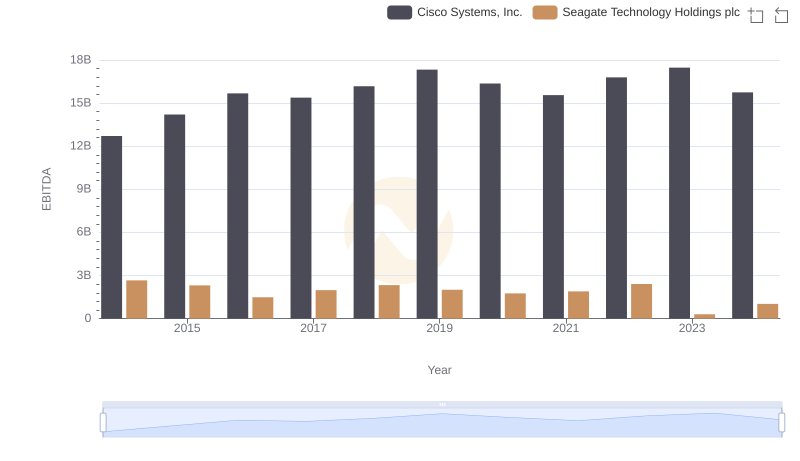
Cisco Systems, Inc. and Seagate Technology Holdings plc: A Detailed Examination of EBITDA Performance