| __timestamp | Cisco Systems, Inc. | Teledyne Technologies Incorporated |
|---|---|---|
| Wednesday, January 1, 2014 | 27769000000 | 906900000 |
| Thursday, January 1, 2015 | 29681000000 | 870300000 |
| Friday, January 1, 2016 | 30960000000 | 831000000 |
| Sunday, January 1, 2017 | 30224000000 | 991600000 |
| Monday, January 1, 2018 | 30606000000 | 1110800000 |
| Tuesday, January 1, 2019 | 32666000000 | 1243300000 |
| Wednesday, January 1, 2020 | 31683000000 | 1180900000 |
| Friday, January 1, 2021 | 31894000000 | 1841400000 |
| Saturday, January 1, 2022 | 32248000000 | 2330300000 |
| Sunday, January 1, 2023 | 35753000000 | 2439400000 |
| Monday, January 1, 2024 | 34828000000 |
In pursuit of knowledge
In the ever-evolving landscape of technology, Cisco Systems, Inc. and Teledyne Technologies Incorporated have carved distinct paths. Over the past decade, Cisco has consistently demonstrated robust growth in gross profit, with a notable 29% increase from 2014 to 2023. This tech behemoth, known for its networking solutions, reached a peak gross profit of approximately $35.8 billion in 2023, showcasing its resilience and adaptability in a competitive market.
Conversely, Teledyne, a leader in instrumentation and digital imaging, has shown a more modest yet steady growth trajectory. From 2014 to 2023, Teledyne's gross profit surged by 169%, reaching around $2.4 billion. This growth underscores Teledyne's strategic expansion and innovation in niche markets.
While Cisco's financial prowess is evident, Teledyne's impressive growth rate highlights its potential in specialized sectors. The absence of 2024 data for Teledyne suggests a need for further analysis to understand its future trajectory.
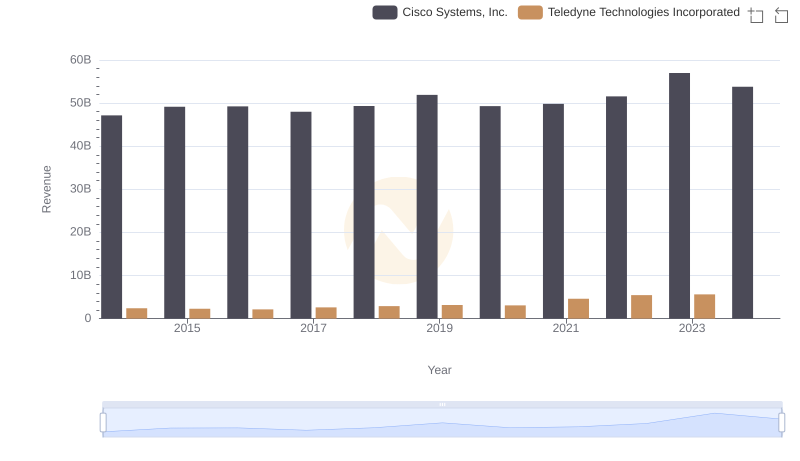
Cisco Systems, Inc. vs Teledyne Technologies Incorporated: Examining Key Revenue Metrics
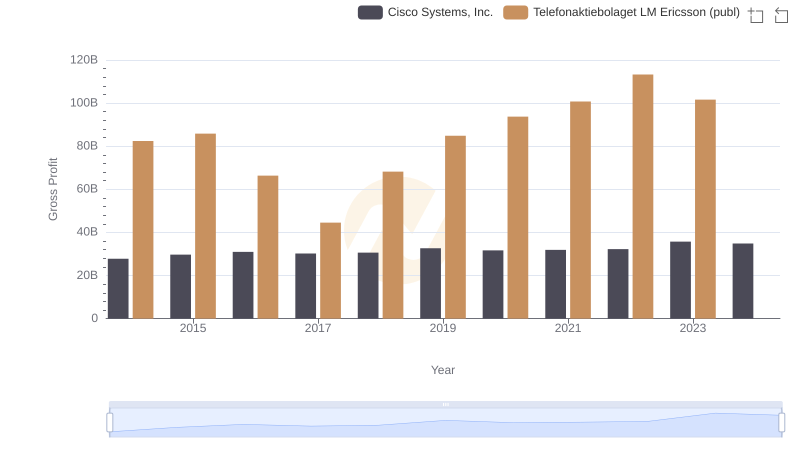
Cisco Systems, Inc. vs Telefonaktiebolaget LM Ericsson (publ): A Gross Profit Performance Breakdown
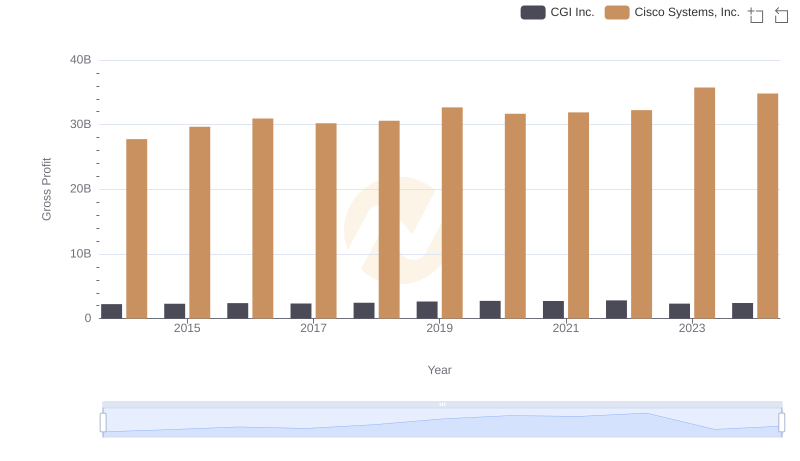
Key Insights on Gross Profit: Cisco Systems, Inc. vs CGI Inc.
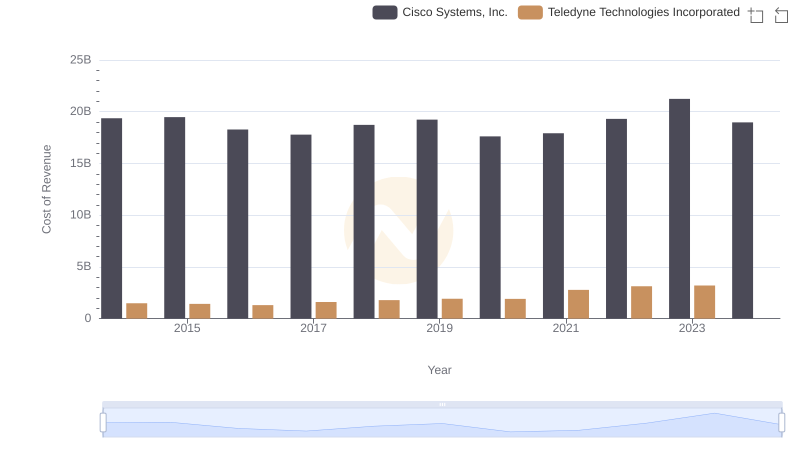
Cost of Revenue Comparison: Cisco Systems, Inc. vs Teledyne Technologies Incorporated
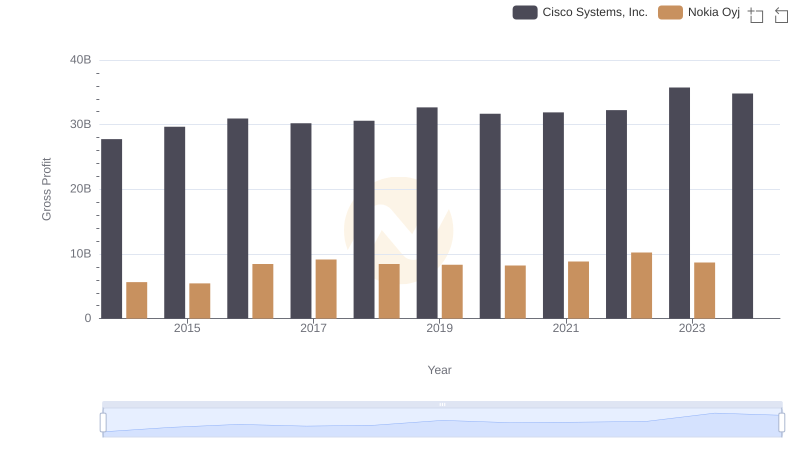
Gross Profit Comparison: Cisco Systems, Inc. and Nokia Oyj Trends
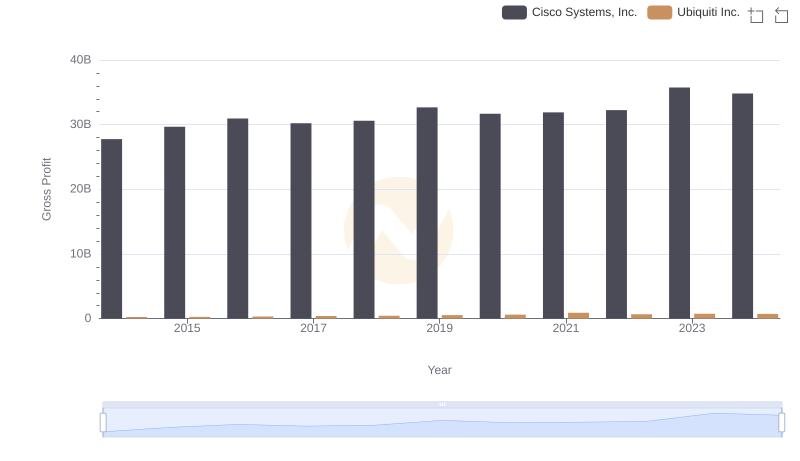
Cisco Systems, Inc. and Ubiquiti Inc.: A Detailed Gross Profit Analysis
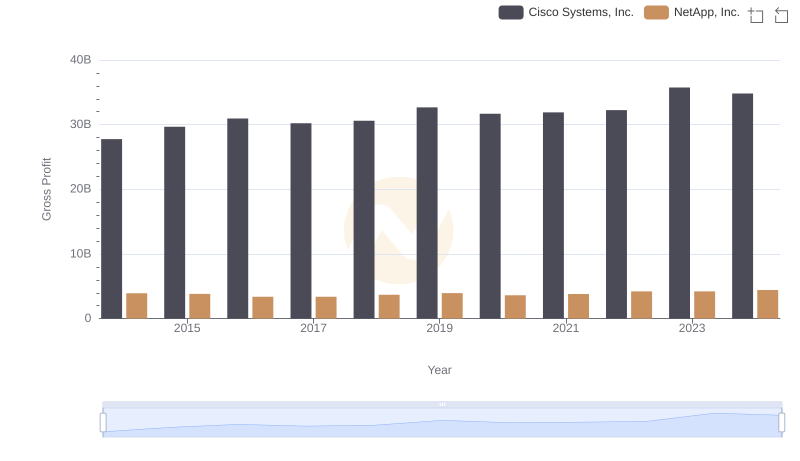
Gross Profit Analysis: Comparing Cisco Systems, Inc. and NetApp, Inc.
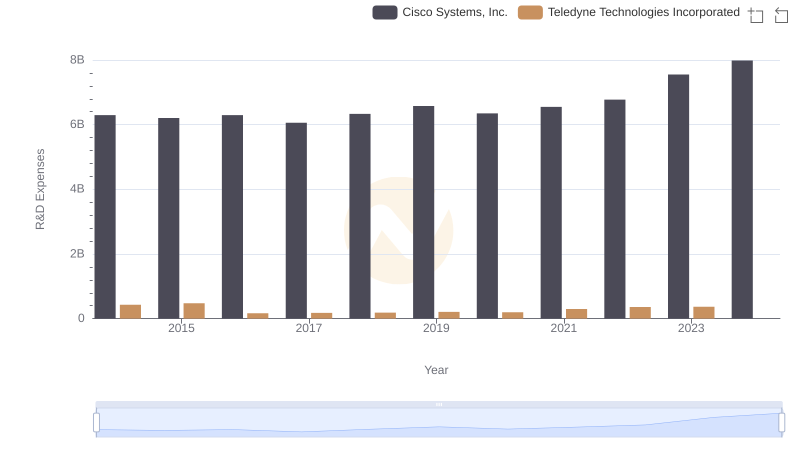
Who Prioritizes Innovation? R&D Spending Compared for Cisco Systems, Inc. and Teledyne Technologies Incorporated
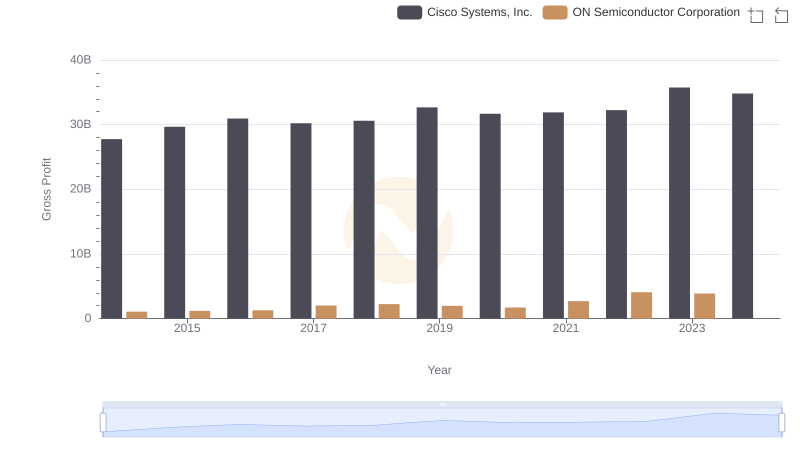
Gross Profit Analysis: Comparing Cisco Systems, Inc. and ON Semiconductor Corporation
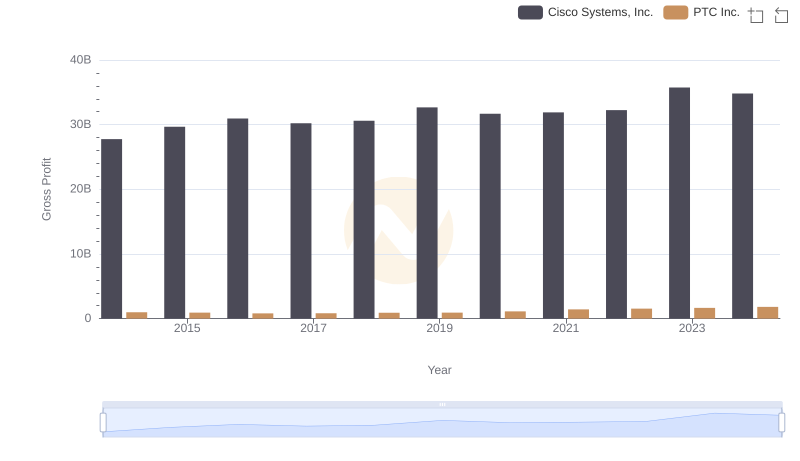
Who Generates Higher Gross Profit? Cisco Systems, Inc. or PTC Inc.
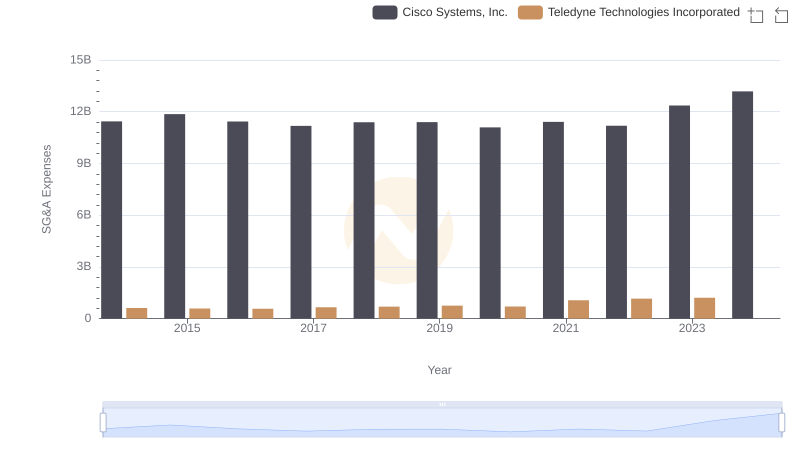
Operational Costs Compared: SG&A Analysis of Cisco Systems, Inc. and Teledyne Technologies Incorporated
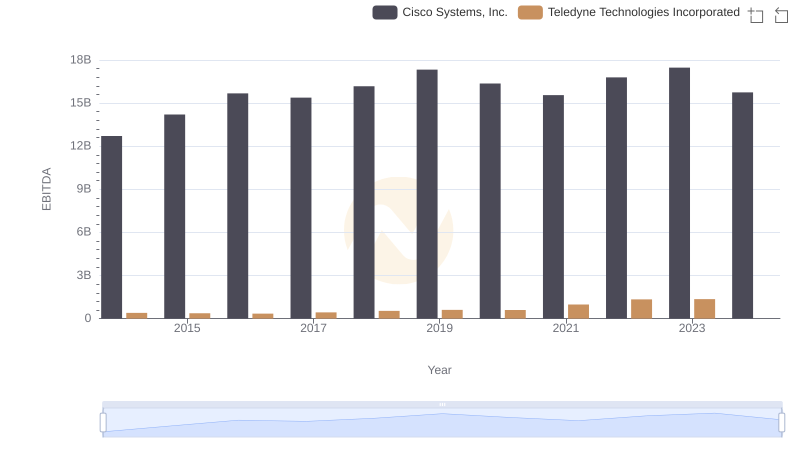
Cisco Systems, Inc. and Teledyne Technologies Incorporated: A Detailed Examination of EBITDA Performance