| __timestamp | Cisco Systems, Inc. | Corpay, Inc. |
|---|---|---|
| Wednesday, January 1, 2014 | 11437000000 | 281490000 |
| Thursday, January 1, 2015 | 11861000000 | 406790000 |
| Friday, January 1, 2016 | 11433000000 | 450953000 |
| Sunday, January 1, 2017 | 11177000000 | 603268000 |
| Monday, January 1, 2018 | 11386000000 | 631142000 |
| Tuesday, January 1, 2019 | 11398000000 | 683511000 |
| Wednesday, January 1, 2020 | 11094000000 | 567410000 |
| Friday, January 1, 2021 | 11411000000 | 747948000 |
| Saturday, January 1, 2022 | 11186000000 | 893217000 |
| Sunday, January 1, 2023 | 12358000000 | 943581000 |
| Monday, January 1, 2024 | 13177000000 | 997780000 |
Unlocking the unknown
In the ever-evolving landscape of corporate finance, understanding the spending patterns of industry leaders can offer valuable insights. Cisco Systems, Inc., a stalwart in networking technology, and Corpay, Inc., a rising star in financial services, present a fascinating study in contrasts. From 2014 to 2023, Cisco's Selling, General, and Administrative (SG&A) expenses have shown a steady increase, peaking at approximately 13% higher in 2023 compared to 2014. In contrast, Corpay's SG&A expenses have surged by over 230% during the same period, reflecting its aggressive growth strategy.
While Cisco's spending reflects a mature company's focus on maintaining market leadership, Corpay's rapid increase underscores its expansion ambitions. Notably, data for 2024 is incomplete, hinting at potential shifts in strategy. This comparison not only highlights the differing trajectories of these companies but also underscores the dynamic nature of corporate financial strategies.
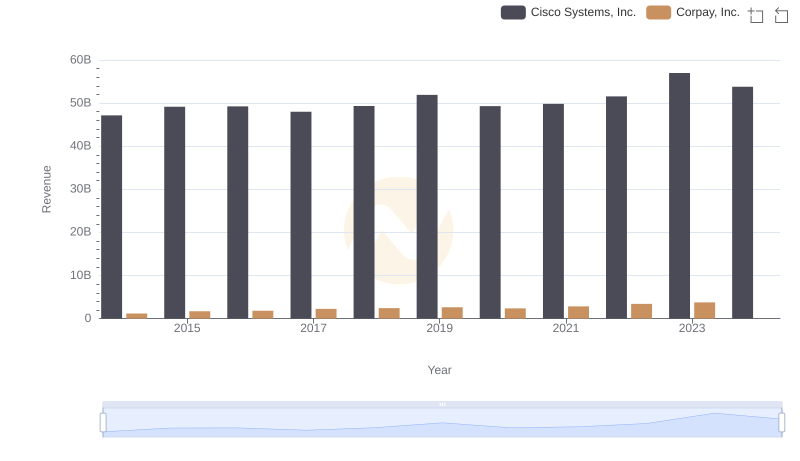
Revenue Showdown: Cisco Systems, Inc. vs Corpay, Inc.
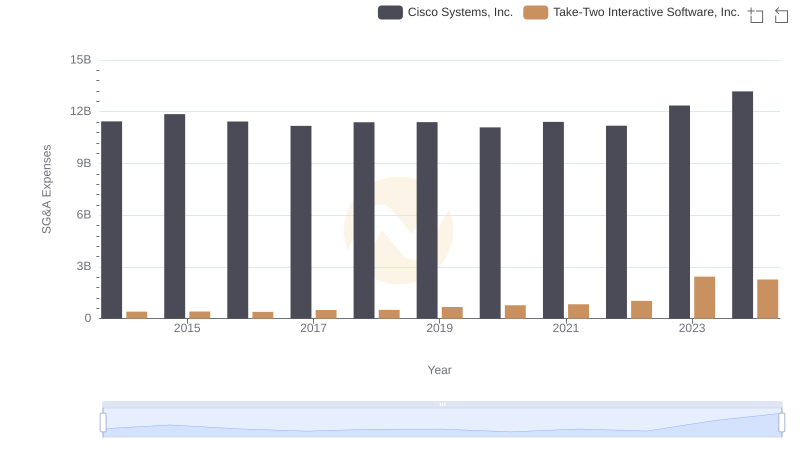
Who Optimizes SG&A Costs Better? Cisco Systems, Inc. or Take-Two Interactive Software, Inc.
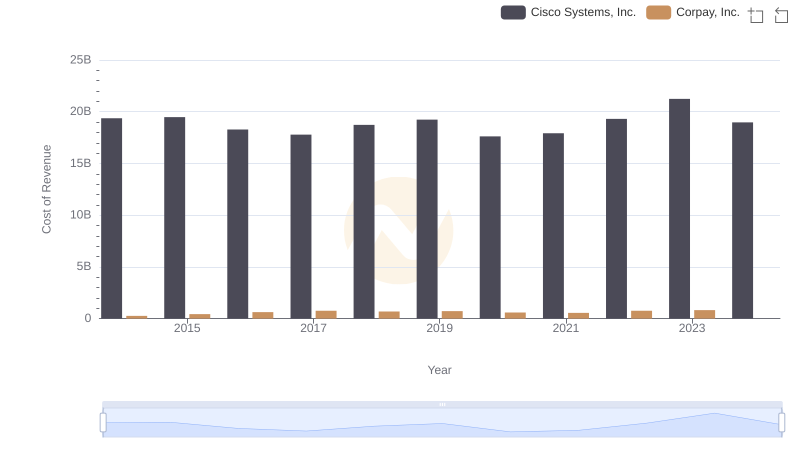
Cost of Revenue Comparison: Cisco Systems, Inc. vs Corpay, Inc.
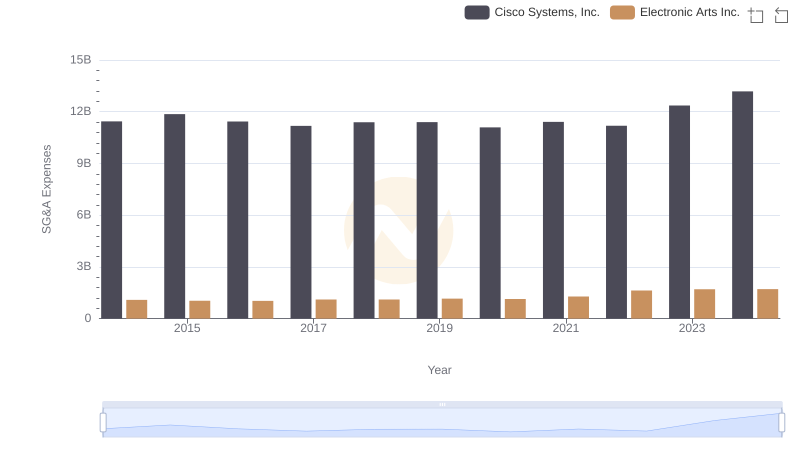
Who Optimizes SG&A Costs Better? Cisco Systems, Inc. or Electronic Arts Inc.
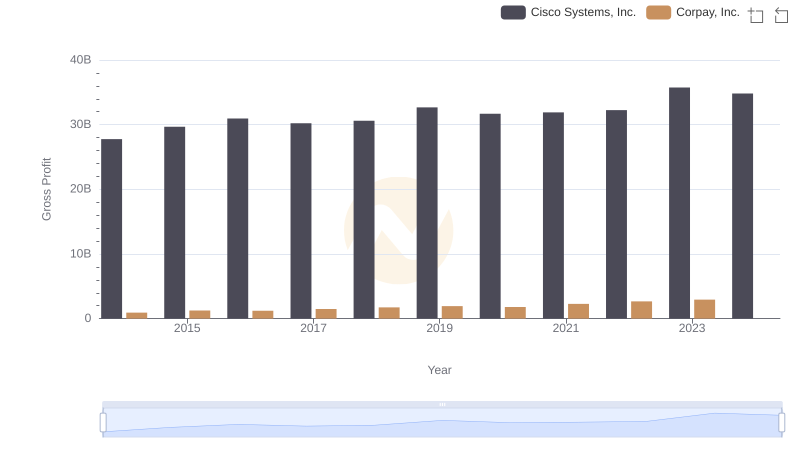
Gross Profit Comparison: Cisco Systems, Inc. and Corpay, Inc. Trends
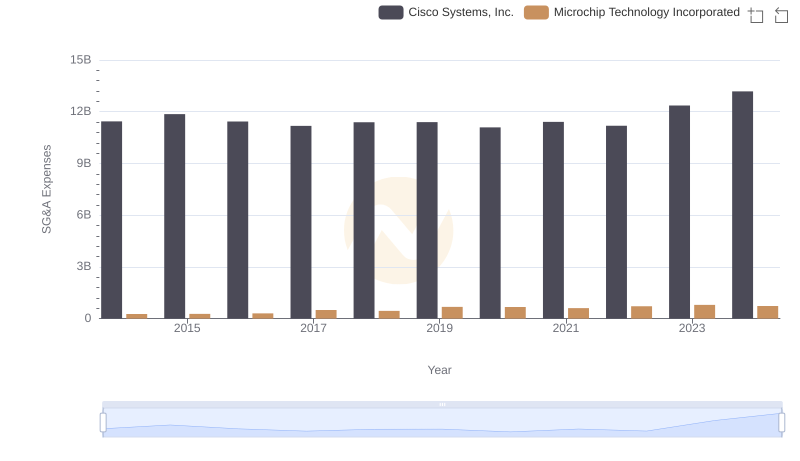
Selling, General, and Administrative Costs: Cisco Systems, Inc. vs Microchip Technology Incorporated
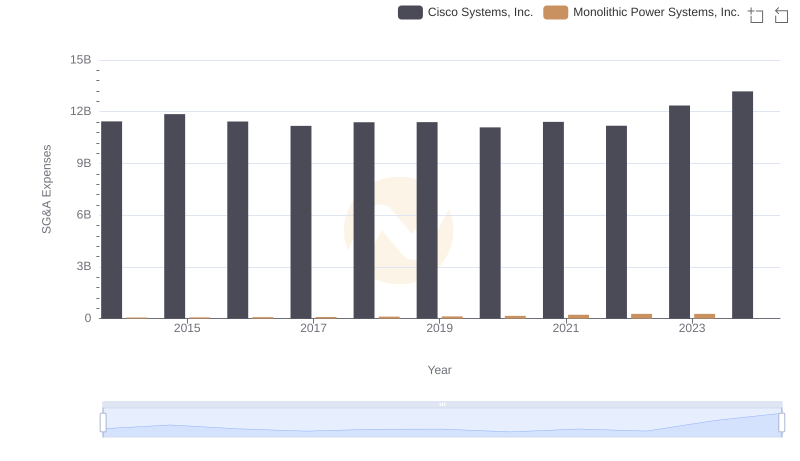
Breaking Down SG&A Expenses: Cisco Systems, Inc. vs Monolithic Power Systems, Inc.
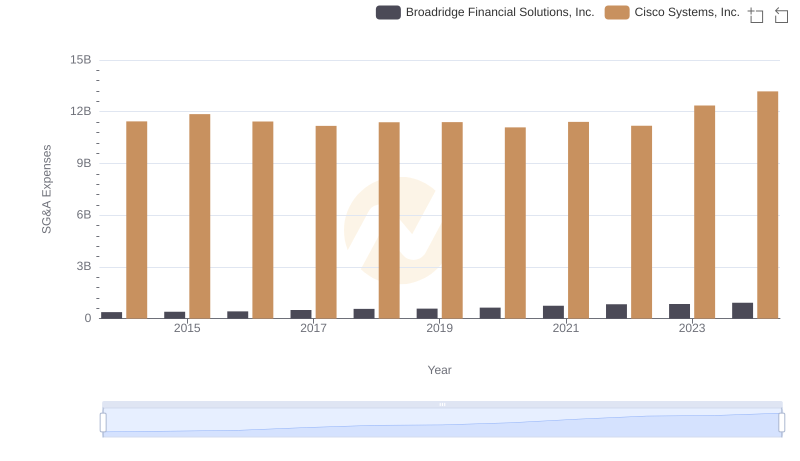
Breaking Down SG&A Expenses: Cisco Systems, Inc. vs Broadridge Financial Solutions, Inc.
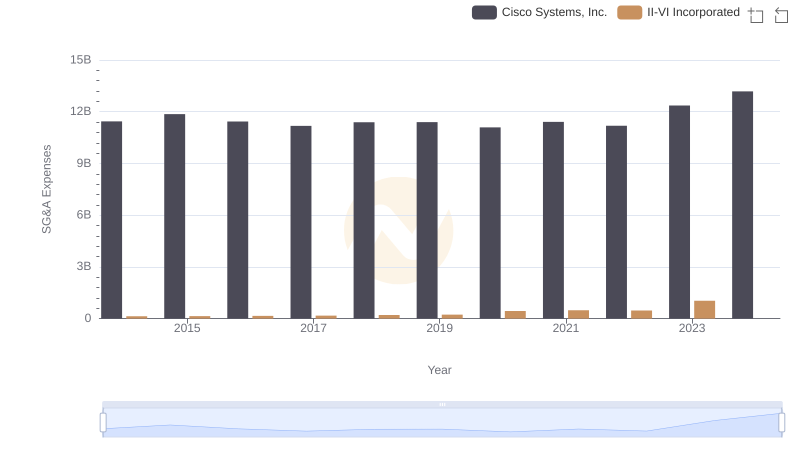
Operational Costs Compared: SG&A Analysis of Cisco Systems, Inc. and II-VI Incorporated
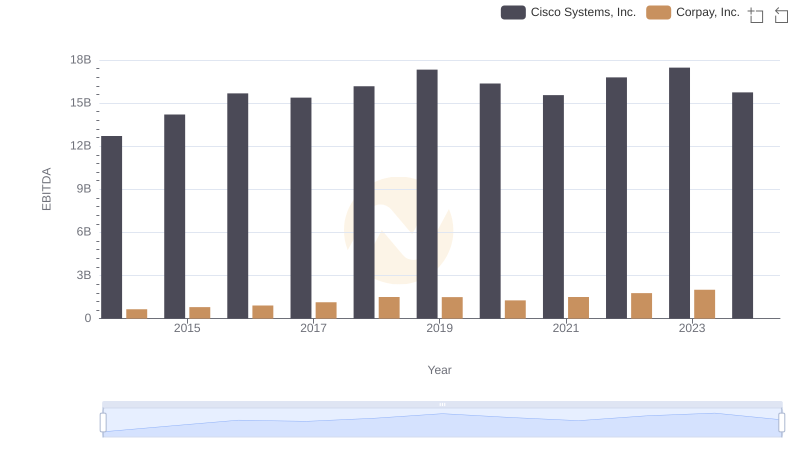
EBITDA Metrics Evaluated: Cisco Systems, Inc. vs Corpay, Inc.
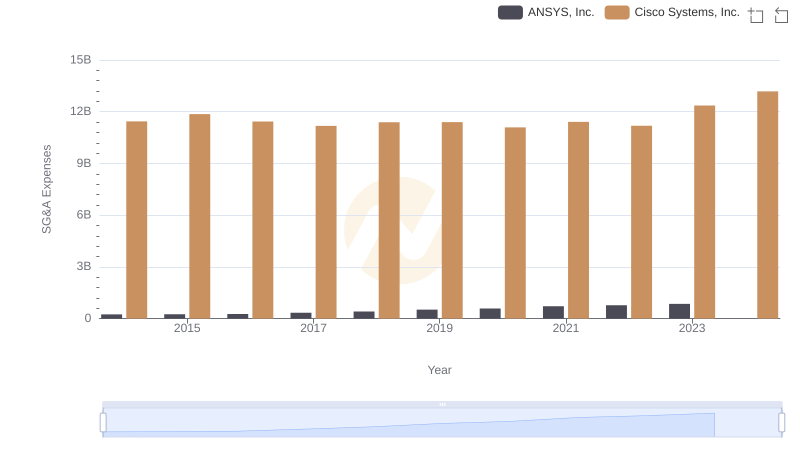
Cisco Systems, Inc. vs ANSYS, Inc.: SG&A Expense Trends
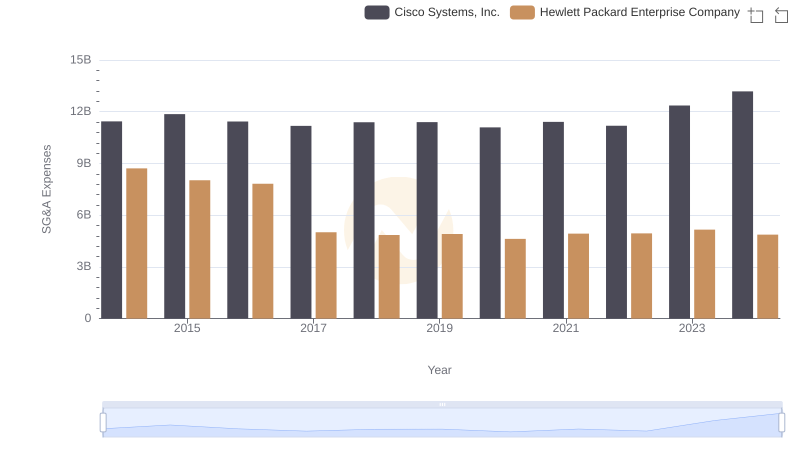
Comparing SG&A Expenses: Cisco Systems, Inc. vs Hewlett Packard Enterprise Company Trends and Insights