| __timestamp | Cisco Systems, Inc. | Corpay, Inc. |
|---|---|---|
| Wednesday, January 1, 2014 | 12709000000 | 654160000 |
| Thursday, January 1, 2015 | 14209000000 | 797545000 |
| Friday, January 1, 2016 | 15678000000 | 912906000 |
| Sunday, January 1, 2017 | 15383000000 | 1142269000 |
| Monday, January 1, 2018 | 16172000000 | 1502885000 |
| Tuesday, January 1, 2019 | 17334000000 | 1491751000 |
| Wednesday, January 1, 2020 | 16363000000 | 1267130000 |
| Friday, January 1, 2021 | 15558000000 | 1506710000 |
| Saturday, January 1, 2022 | 16794000000 | 1770532000 |
| Sunday, January 1, 2023 | 17471000000 | 2008995000 |
| Monday, January 1, 2024 | 15747000000 | 2119258000 |
Unveiling the hidden dimensions of data
In the ever-evolving landscape of technology and finance, Cisco Systems, Inc. and Corpay, Inc. stand as titans in their respective fields. Over the past decade, Cisco has consistently demonstrated robust growth in its EBITDA, peaking in 2023 with a remarkable 37% increase from 2014. This growth underscores Cisco's strategic prowess in adapting to market demands and technological advancements.
Conversely, Corpay, Inc. has shown a dynamic trajectory, with its EBITDA surging by over 200% from 2014 to 2023. This impressive growth highlights Corpay's agility and innovative approach in the financial sector. However, data for 2024 remains elusive, leaving room for speculation on future trends.
As we delve into these metrics, the contrasting paths of Cisco and Corpay offer a fascinating glimpse into the strategies that drive success in the competitive arenas of technology and finance.
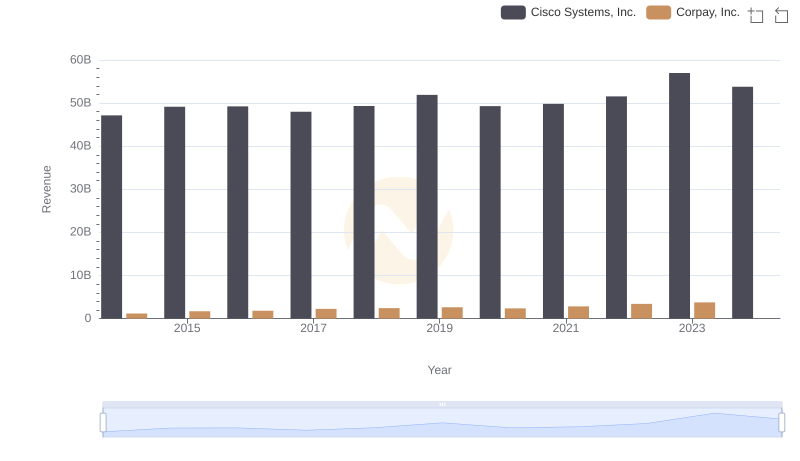
Revenue Showdown: Cisco Systems, Inc. vs Corpay, Inc.
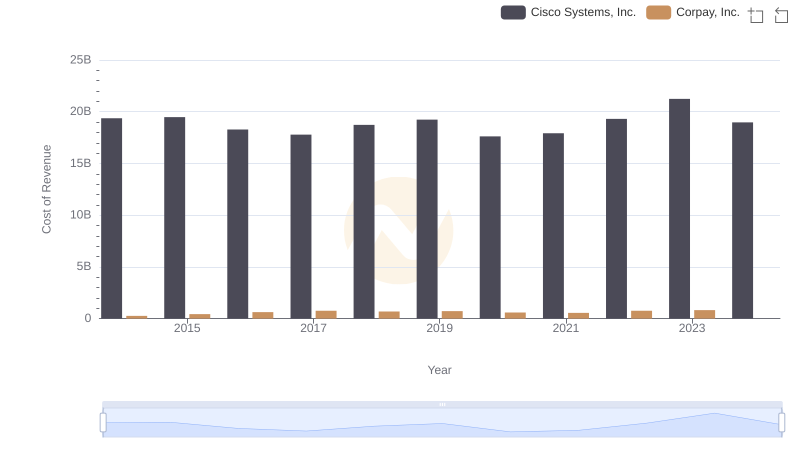
Cost of Revenue Comparison: Cisco Systems, Inc. vs Corpay, Inc.
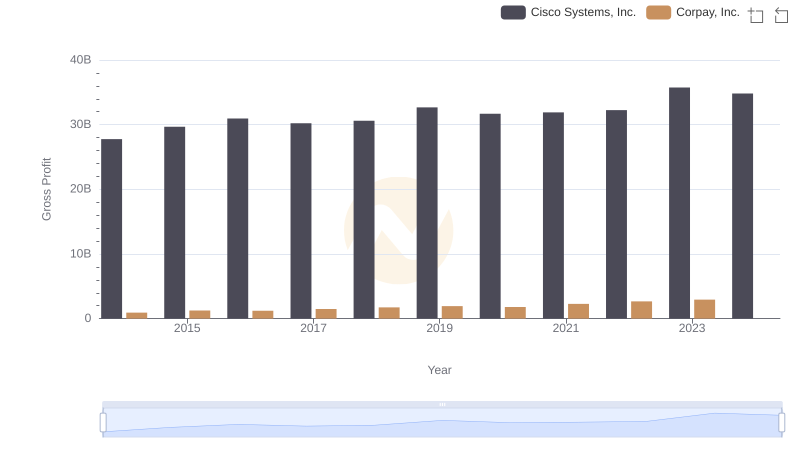
Gross Profit Comparison: Cisco Systems, Inc. and Corpay, Inc. Trends
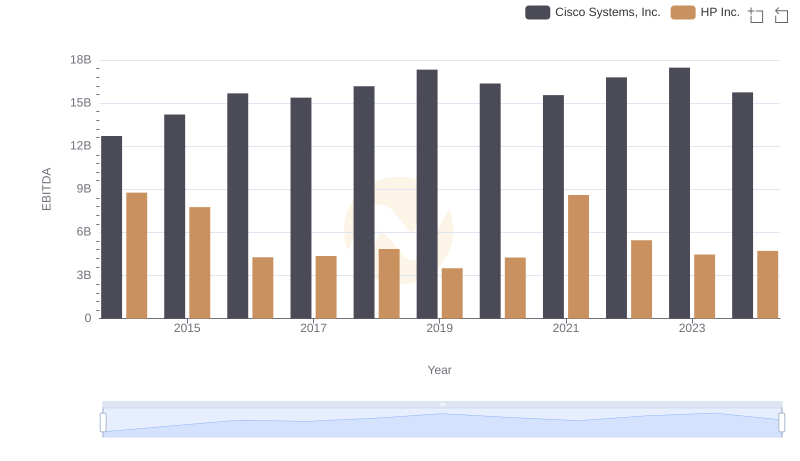
Professional EBITDA Benchmarking: Cisco Systems, Inc. vs HP Inc.
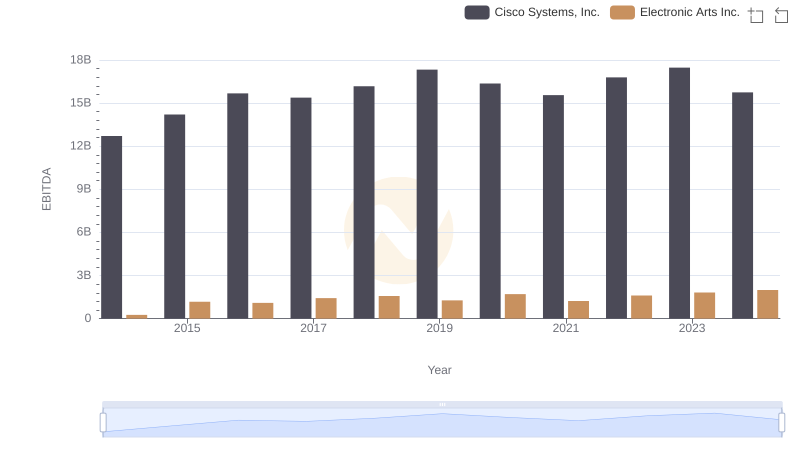
Professional EBITDA Benchmarking: Cisco Systems, Inc. vs Electronic Arts Inc.
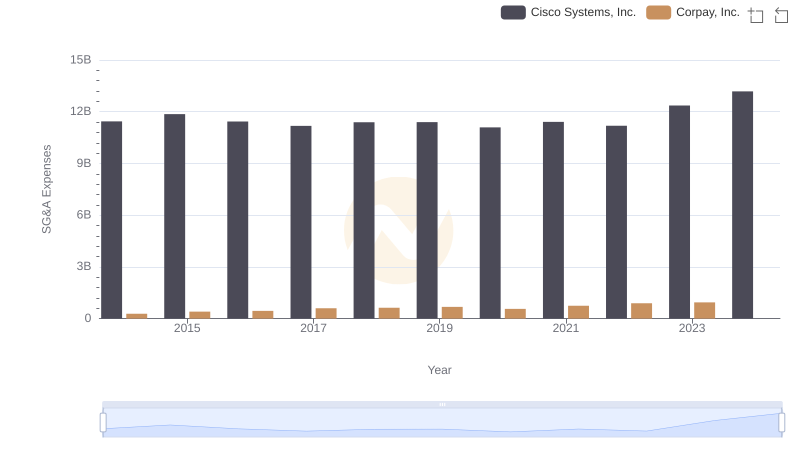
Cisco Systems, Inc. and Corpay, Inc.: SG&A Spending Patterns Compared
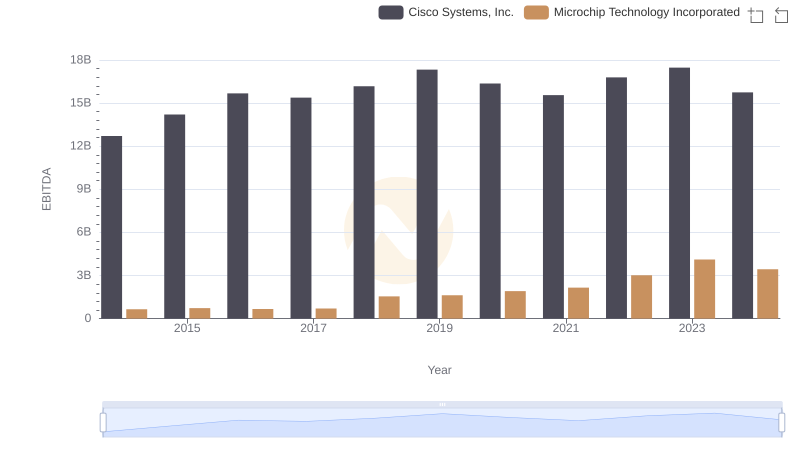
A Side-by-Side Analysis of EBITDA: Cisco Systems, Inc. and Microchip Technology Incorporated

EBITDA Metrics Evaluated: Cisco Systems, Inc. vs Monolithic Power Systems, Inc.
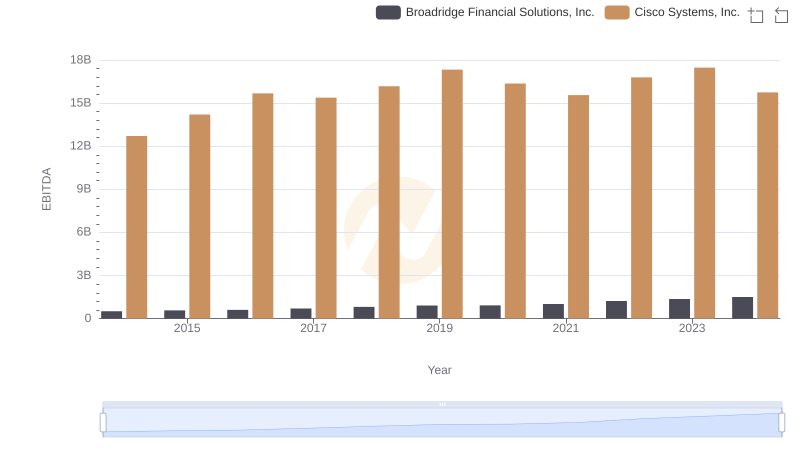
EBITDA Metrics Evaluated: Cisco Systems, Inc. vs Broadridge Financial Solutions, Inc.
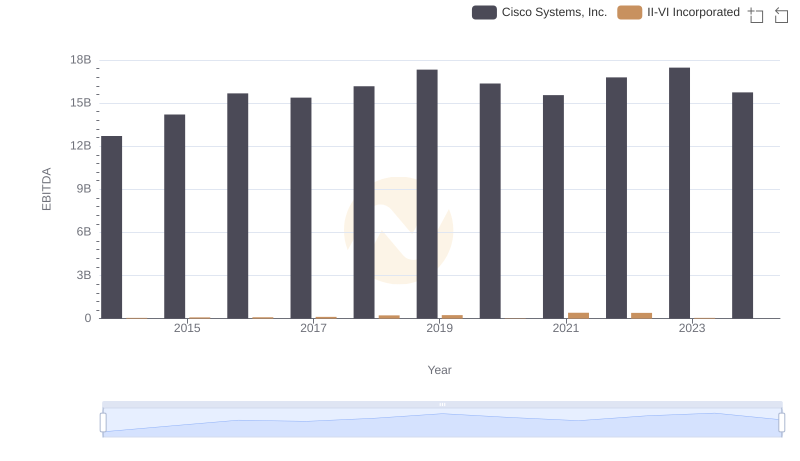
EBITDA Performance Review: Cisco Systems, Inc. vs II-VI Incorporated
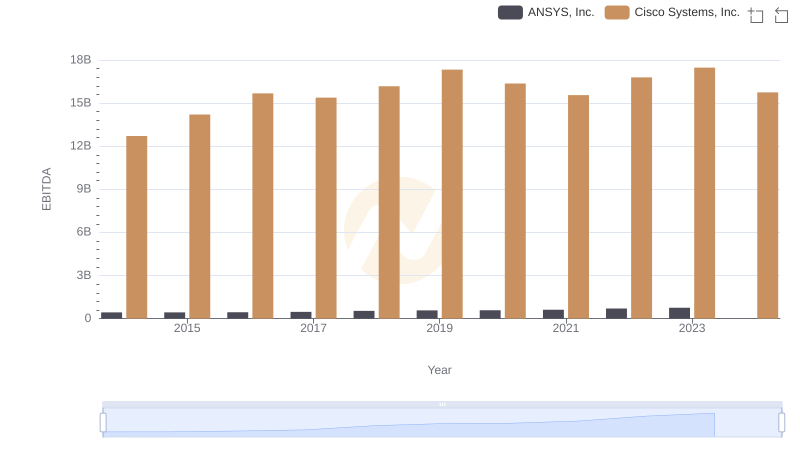
A Side-by-Side Analysis of EBITDA: Cisco Systems, Inc. and ANSYS, Inc.
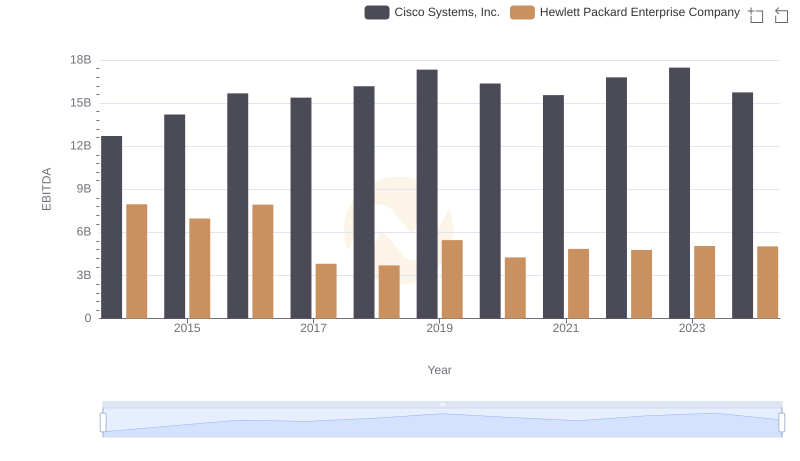
Comparative EBITDA Analysis: Cisco Systems, Inc. vs Hewlett Packard Enterprise Company