| __timestamp | ANSYS, Inc. | Cisco Systems, Inc. |
|---|---|---|
| Wednesday, January 1, 2014 | 153386000 | 19373000000 |
| Thursday, January 1, 2015 | 147246000 | 19480000000 |
| Friday, January 1, 2016 | 146860000 | 18287000000 |
| Sunday, January 1, 2017 | 150164000 | 17781000000 |
| Monday, January 1, 2018 | 155885000 | 18724000000 |
| Tuesday, January 1, 2019 | 166273000 | 19238000000 |
| Wednesday, January 1, 2020 | 225264000 | 17618000000 |
| Friday, January 1, 2021 | 257984000 | 17924000000 |
| Saturday, January 1, 2022 | 250641000 | 19309000000 |
| Sunday, January 1, 2023 | 271298000 | 21245000000 |
| Monday, January 1, 2024 | 279819000 | 18975000000 |
Unlocking the unknown
In the ever-evolving landscape of technology, understanding cost dynamics is crucial. Cisco Systems, Inc. and ANSYS, Inc., two titans in their respective fields, offer a fascinating study in contrasts. From 2014 to 2023, Cisco's cost of revenue has shown a steady pattern, peaking in 2023 with a 21% increase from its 2014 figures. Meanwhile, ANSYS has experienced a more volatile journey, with a notable 77% rise over the same period. This divergence highlights the differing operational strategies and market conditions faced by these companies. Cisco's consistent cost management reflects its robust supply chain and operational efficiency, while ANSYS's fluctuations may indicate strategic investments in innovation and growth. As we look to the future, these trends offer valuable insights into the financial health and strategic priorities of these industry leaders.
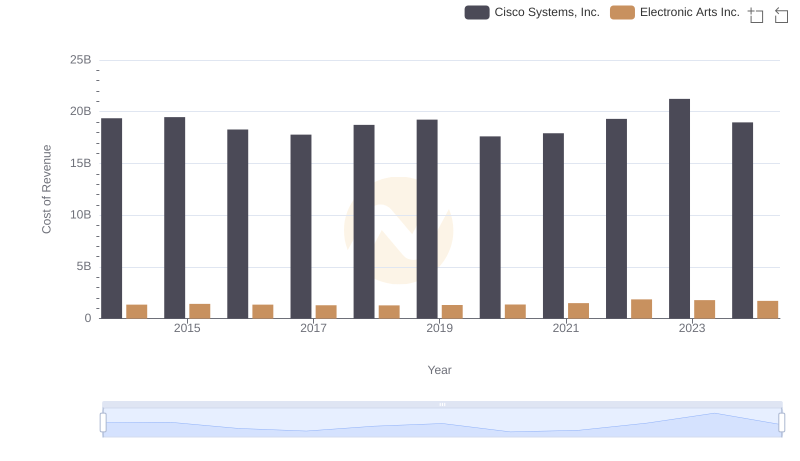
Cost of Revenue: Key Insights for Cisco Systems, Inc. and Electronic Arts Inc.
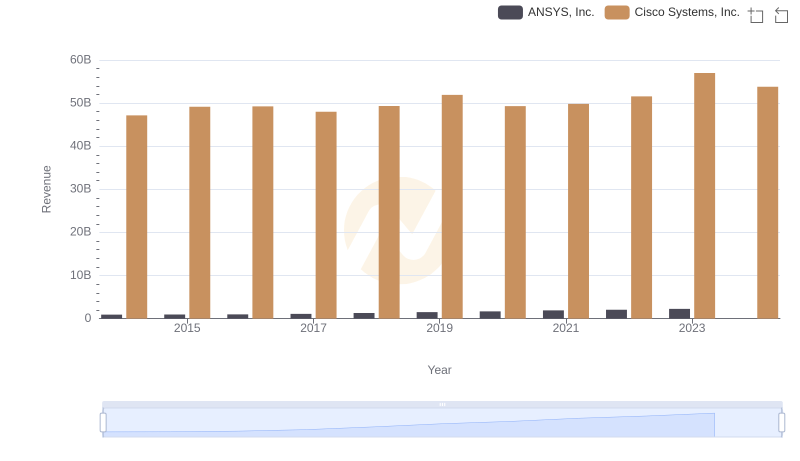
Breaking Down Revenue Trends: Cisco Systems, Inc. vs ANSYS, Inc.
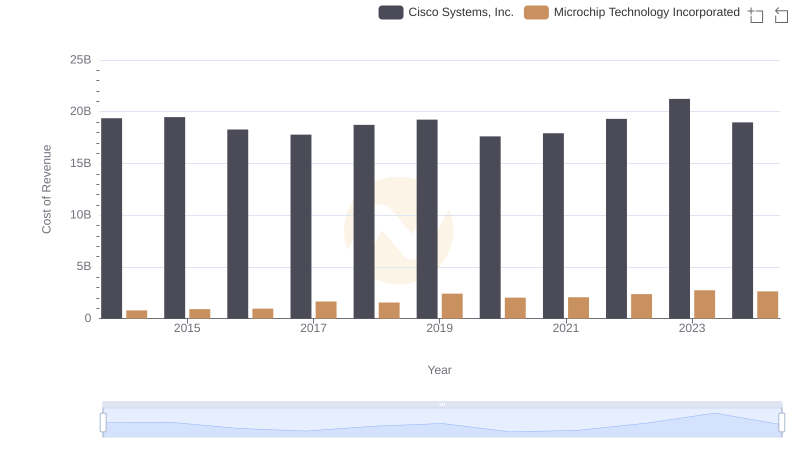
Analyzing Cost of Revenue: Cisco Systems, Inc. and Microchip Technology Incorporated
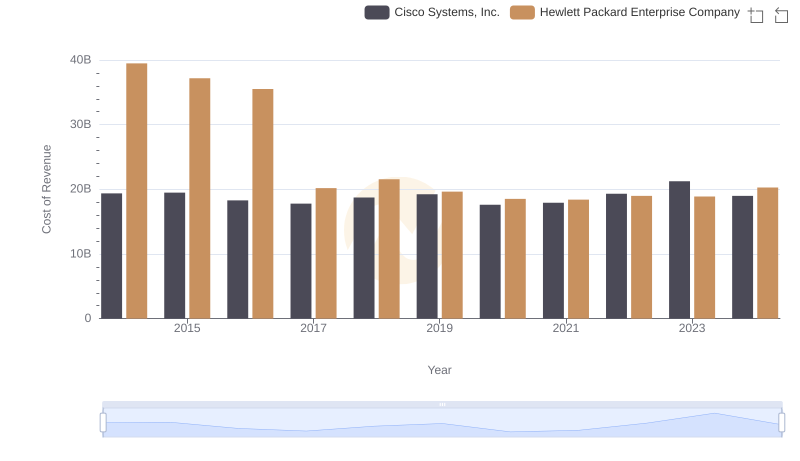
Cost of Revenue Comparison: Cisco Systems, Inc. vs Hewlett Packard Enterprise Company
Cost Insights: Breaking Down Cisco Systems, Inc. and II-VI Incorporated's Expenses
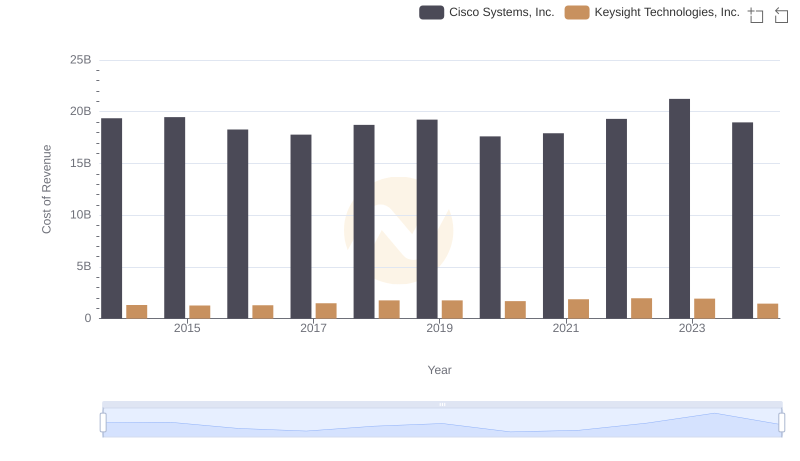
Cisco Systems, Inc. vs Keysight Technologies, Inc.: Efficiency in Cost of Revenue Explored
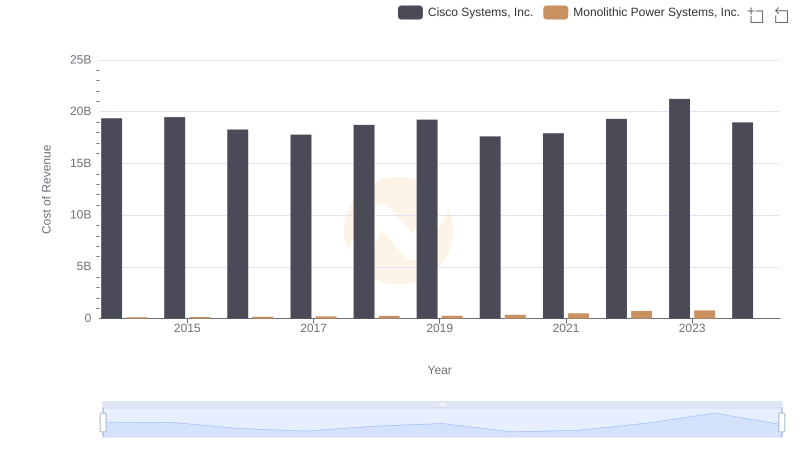
Comparing Cost of Revenue Efficiency: Cisco Systems, Inc. vs Monolithic Power Systems, Inc.
Key Insights on Gross Profit: Cisco Systems, Inc. vs ANSYS, Inc.
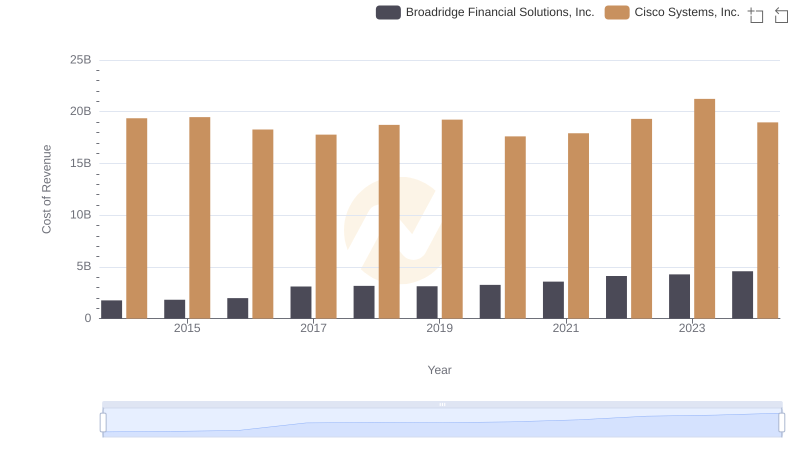
Analyzing Cost of Revenue: Cisco Systems, Inc. and Broadridge Financial Solutions, Inc.
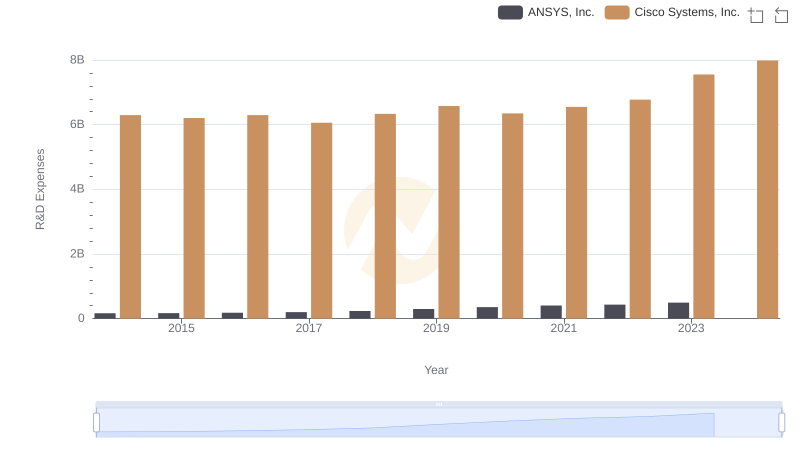
Comparing Innovation Spending: Cisco Systems, Inc. and ANSYS, Inc.
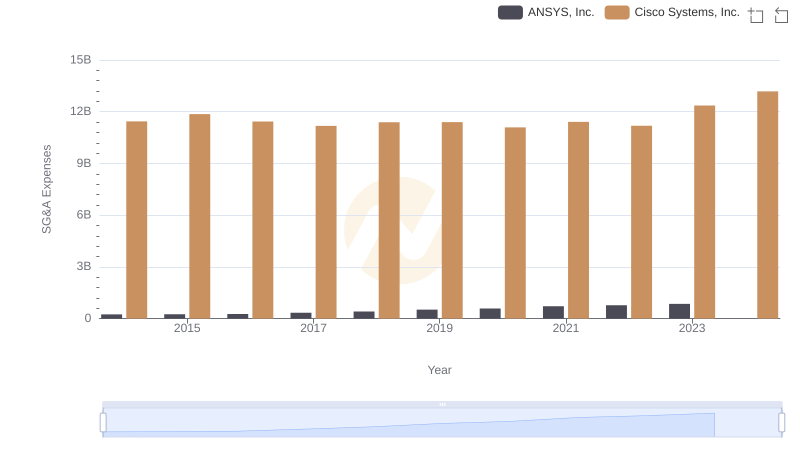
Cisco Systems, Inc. vs ANSYS, Inc.: SG&A Expense Trends
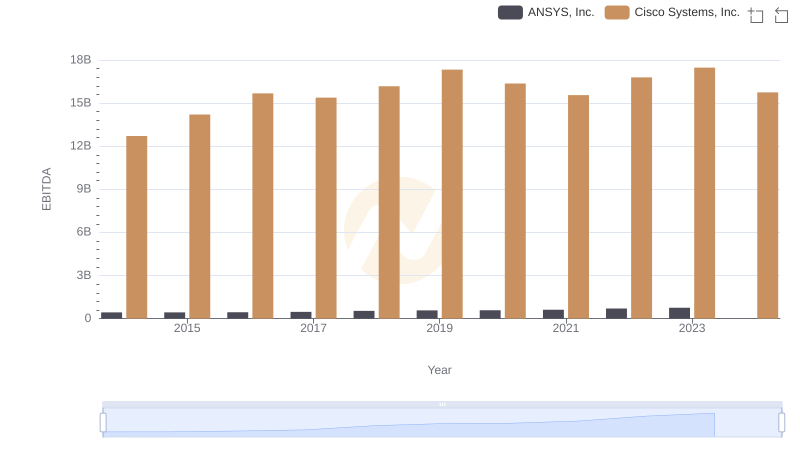
A Side-by-Side Analysis of EBITDA: Cisco Systems, Inc. and ANSYS, Inc.