| __timestamp | Axon Enterprise, Inc. | Pool Corporation |
|---|---|---|
| Wednesday, January 1, 2014 | 62977000 | 1603222000 |
| Thursday, January 1, 2015 | 69245000 | 1687495000 |
| Friday, January 1, 2016 | 97709000 | 1829716000 |
| Sunday, January 1, 2017 | 136710000 | 1982899000 |
| Monday, January 1, 2018 | 161485000 | 2127924000 |
| Tuesday, January 1, 2019 | 223574000 | 2274592000 |
| Wednesday, January 1, 2020 | 264672000 | 2805721000 |
| Friday, January 1, 2021 | 322471000 | 3678492000 |
| Saturday, January 1, 2022 | 461297000 | 4246315000 |
| Sunday, January 1, 2023 | 608009000 | 3881551000 |
Data in motion
In the ever-evolving landscape of American business, Axon Enterprise, Inc. and Pool Corporation stand as intriguing case studies in cost management. Over the past decade, from 2014 to 2023, these companies have shown distinct trajectories in their cost of revenue. Axon Enterprise, Inc., known for its innovative public safety technologies, has seen its cost of revenue grow nearly tenfold, reflecting its aggressive expansion and investment in cutting-edge solutions. In contrast, Pool Corporation, a leader in the pool supply industry, has maintained a more stable growth, with its cost of revenue increasing by approximately 140% over the same period. This comparison highlights the diverse strategies employed by companies in different sectors to manage their operational costs. As we delve into these figures, it becomes evident that understanding cost dynamics is crucial for investors and stakeholders aiming to gauge a company's financial health and strategic direction.
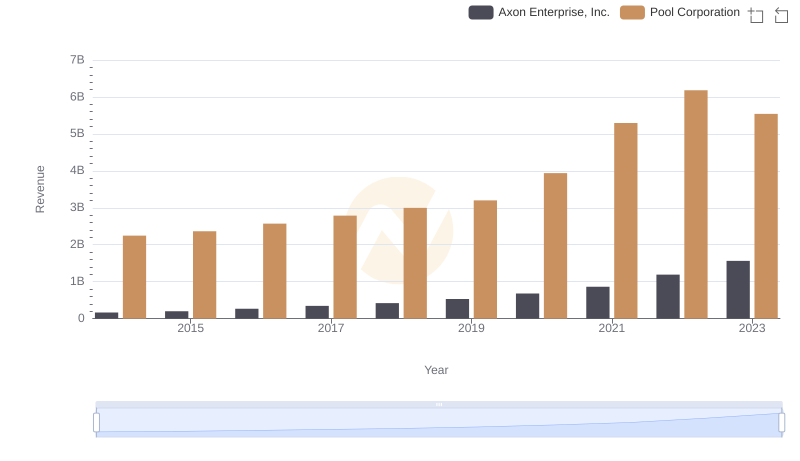
Axon Enterprise, Inc. vs Pool Corporation: Annual Revenue Growth Compared
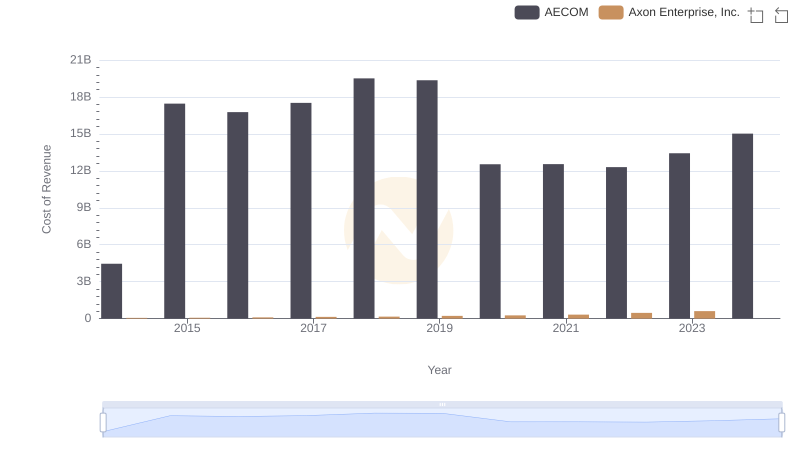
Comparing Cost of Revenue Efficiency: Axon Enterprise, Inc. vs AECOM
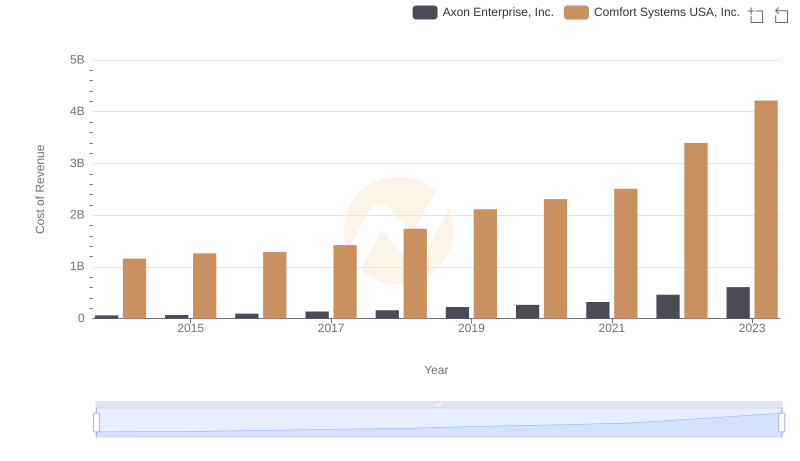
Analyzing Cost of Revenue: Axon Enterprise, Inc. and Comfort Systems USA, Inc.
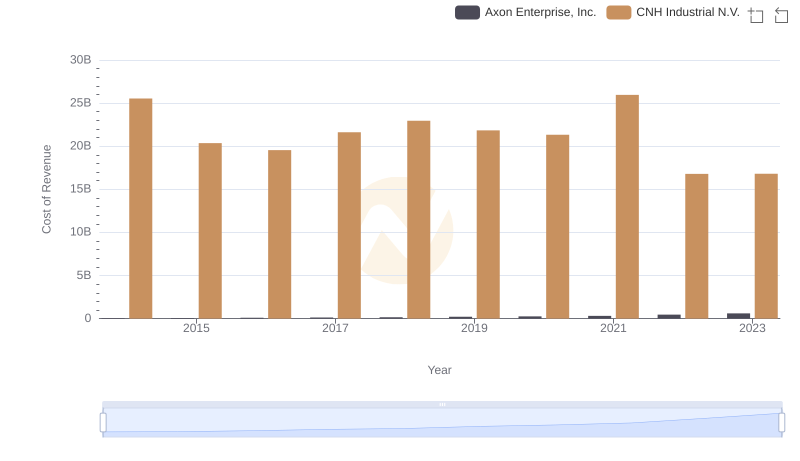
Cost Insights: Breaking Down Axon Enterprise, Inc. and CNH Industrial N.V.'s Expenses
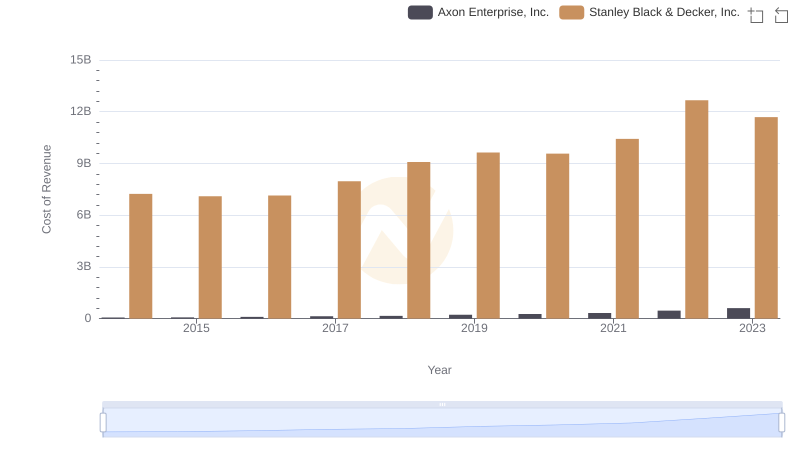
Cost Insights: Breaking Down Axon Enterprise, Inc. and Stanley Black & Decker, Inc.'s Expenses
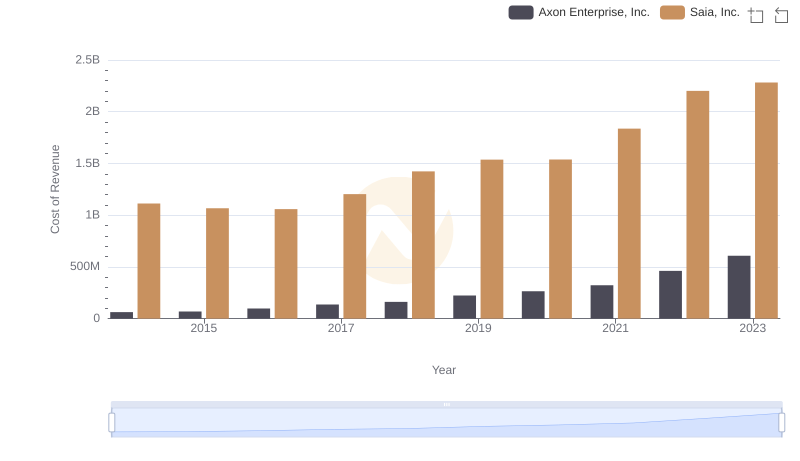
Cost of Revenue Trends: Axon Enterprise, Inc. vs Saia, Inc.
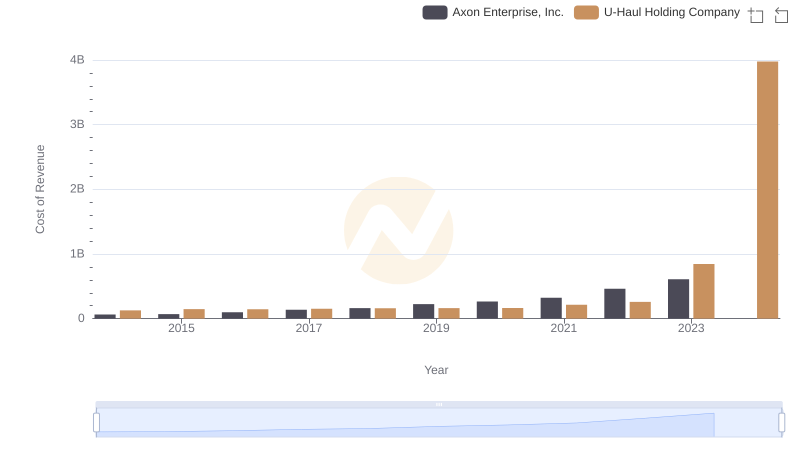
Cost Insights: Breaking Down Axon Enterprise, Inc. and U-Haul Holding Company's Expenses
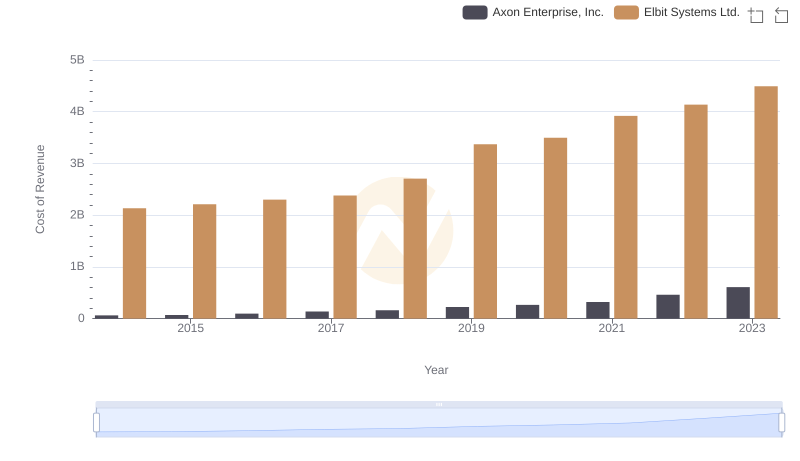
Analyzing Cost of Revenue: Axon Enterprise, Inc. and Elbit Systems Ltd.
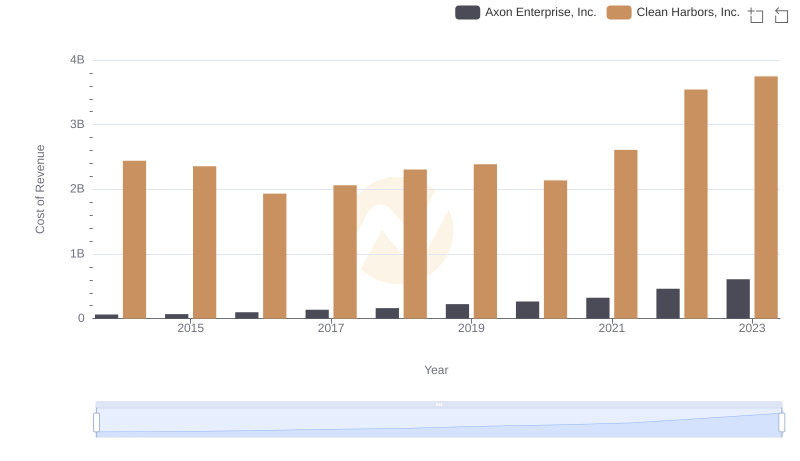
Analyzing Cost of Revenue: Axon Enterprise, Inc. and Clean Harbors, Inc.
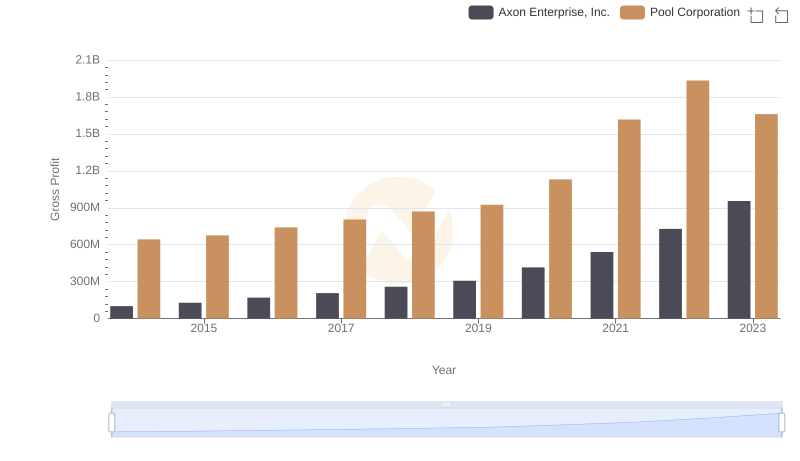
Gross Profit Analysis: Comparing Axon Enterprise, Inc. and Pool Corporation
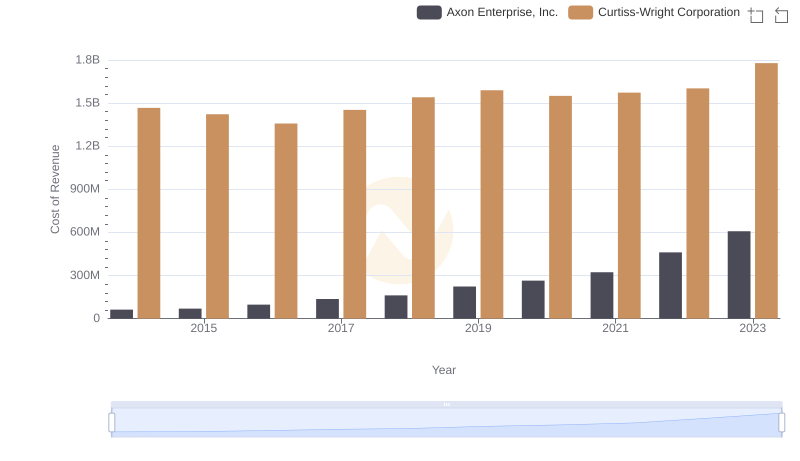
Cost of Revenue Trends: Axon Enterprise, Inc. vs Curtiss-Wright Corporation
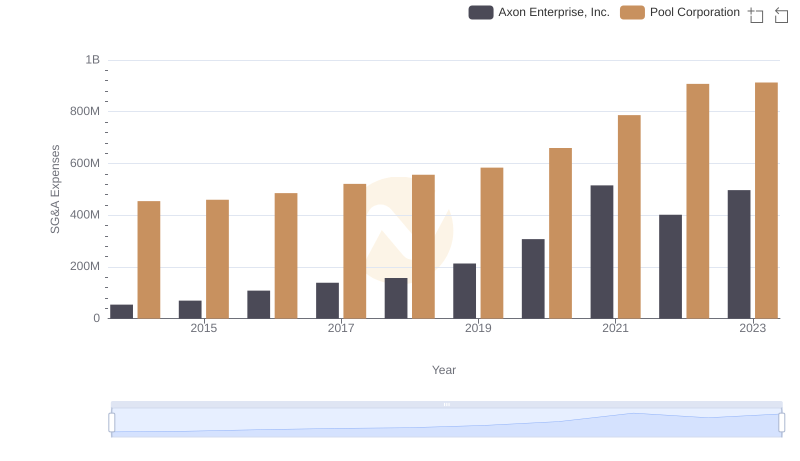
Comparing SG&A Expenses: Axon Enterprise, Inc. vs Pool Corporation Trends and Insights