| __timestamp | Axon Enterprise, Inc. | Elbit Systems Ltd. |
|---|---|---|
| Wednesday, January 1, 2014 | 62977000 | 2133151000 |
| Thursday, January 1, 2015 | 69245000 | 2210528000 |
| Friday, January 1, 2016 | 97709000 | 2300636000 |
| Sunday, January 1, 2017 | 136710000 | 2379905000 |
| Monday, January 1, 2018 | 161485000 | 2707505000 |
| Tuesday, January 1, 2019 | 223574000 | 3371933000 |
| Wednesday, January 1, 2020 | 264672000 | 3497465000 |
| Friday, January 1, 2021 | 322471000 | 3920473000 |
| Saturday, January 1, 2022 | 461297000 | 4138266000 |
| Sunday, January 1, 2023 | 608009000 | 4491790000 |
Unveiling the hidden dimensions of data
In the ever-evolving landscape of global defense and public safety, understanding the financial dynamics of key players is crucial. Over the past decade, Axon Enterprise, Inc. and Elbit Systems Ltd. have demonstrated contrasting trajectories in their cost of revenue. From 2014 to 2023, Axon Enterprise, Inc. saw a staggering increase of nearly 866% in its cost of revenue, reflecting its aggressive expansion and innovation in public safety technology. In contrast, Elbit Systems Ltd., a giant in the defense sector, experienced a more modest growth of approximately 110% during the same period. This disparity highlights the different scales and strategies of these companies. While Axon focuses on rapid growth and technological advancements, Elbit maintains a steady course in a highly competitive defense market. These insights provide a window into the strategic priorities and market positioning of these industry leaders.
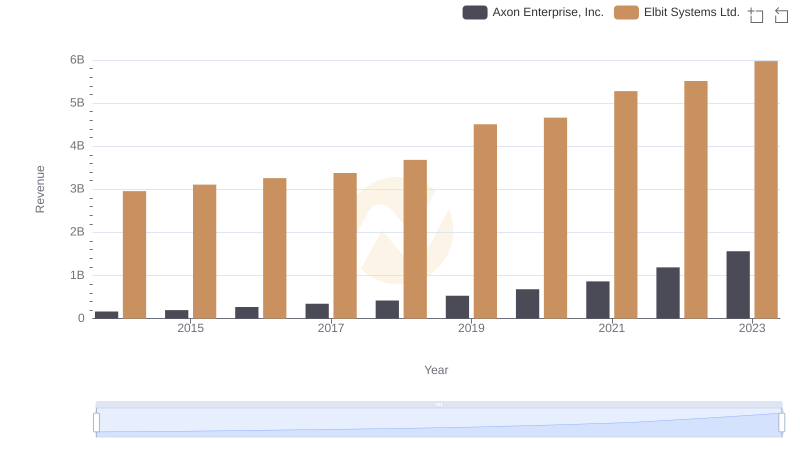
Revenue Insights: Axon Enterprise, Inc. and Elbit Systems Ltd. Performance Compared
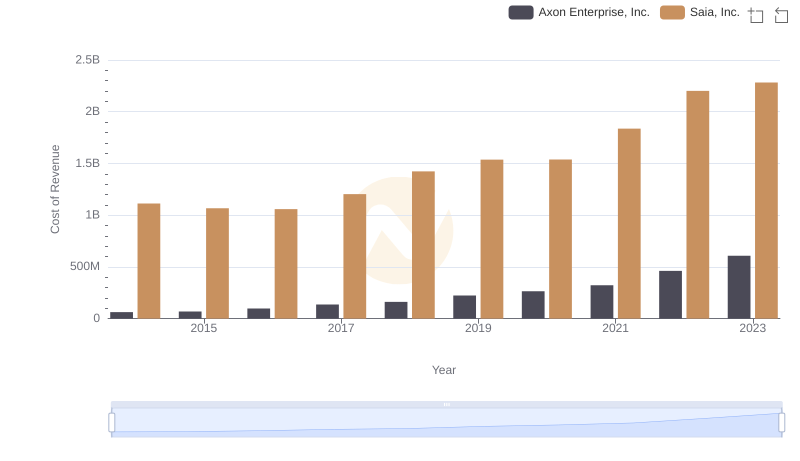
Cost of Revenue Trends: Axon Enterprise, Inc. vs Saia, Inc.
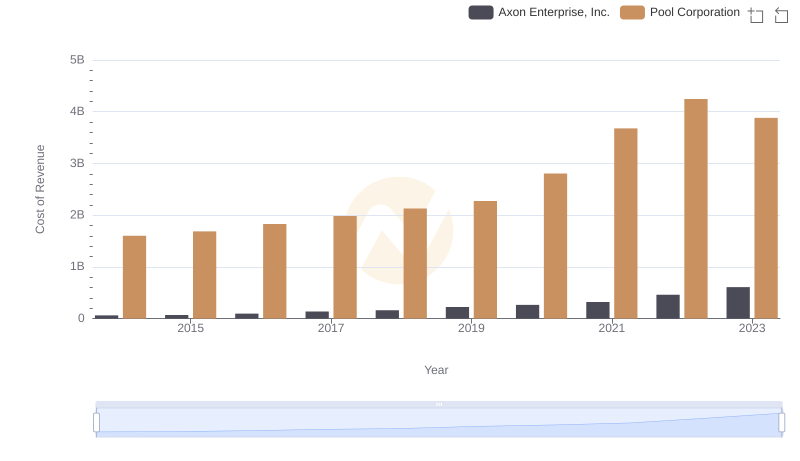
Cost of Revenue Comparison: Axon Enterprise, Inc. vs Pool Corporation
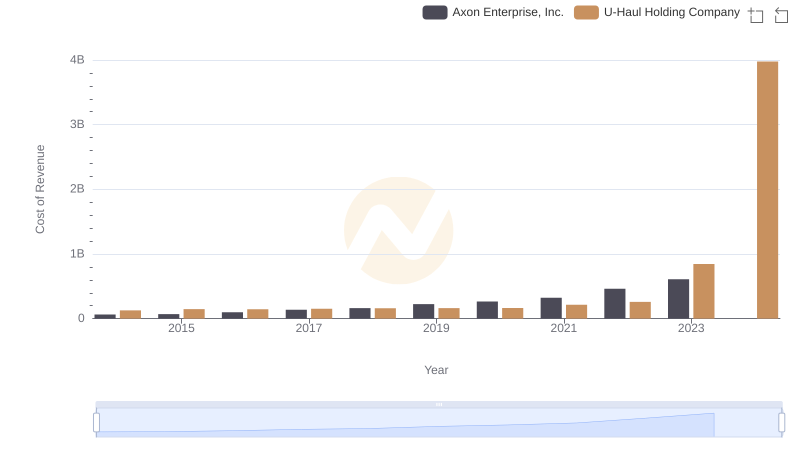
Cost Insights: Breaking Down Axon Enterprise, Inc. and U-Haul Holding Company's Expenses
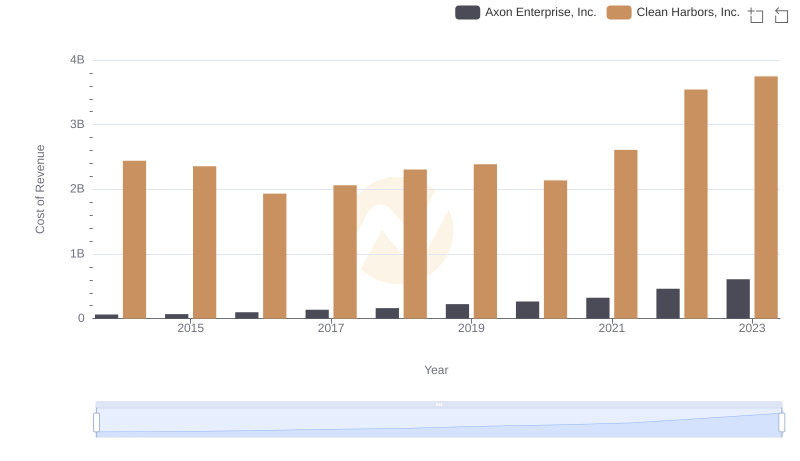
Analyzing Cost of Revenue: Axon Enterprise, Inc. and Clean Harbors, Inc.
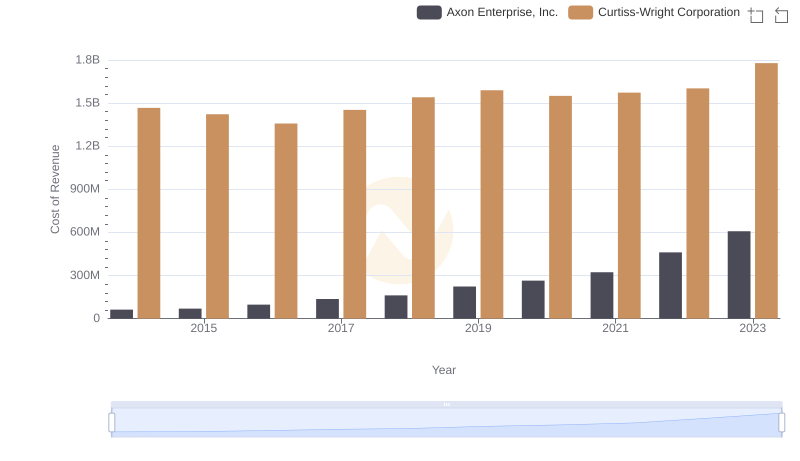
Cost of Revenue Trends: Axon Enterprise, Inc. vs Curtiss-Wright Corporation
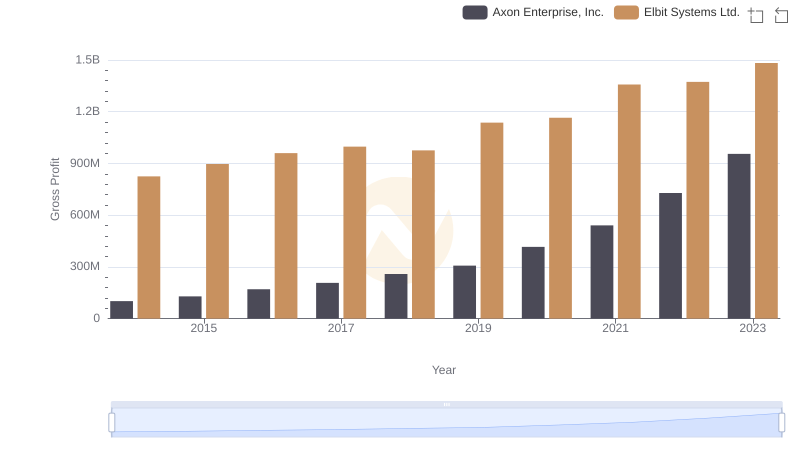
Gross Profit Analysis: Comparing Axon Enterprise, Inc. and Elbit Systems Ltd.
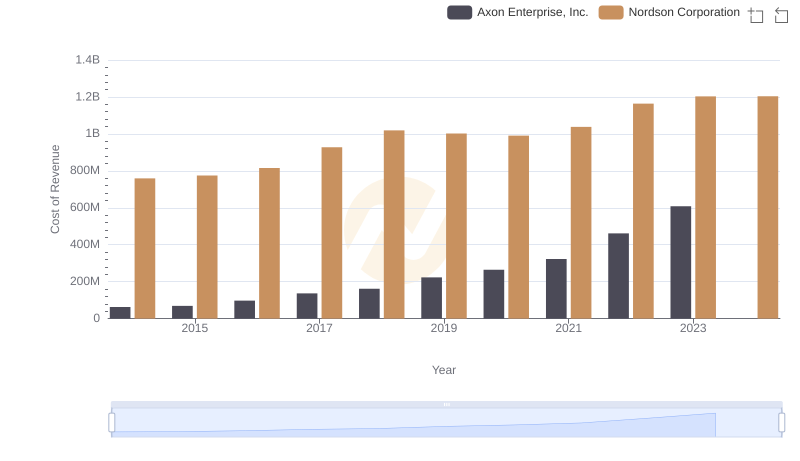
Cost of Revenue Trends: Axon Enterprise, Inc. vs Nordson Corporation
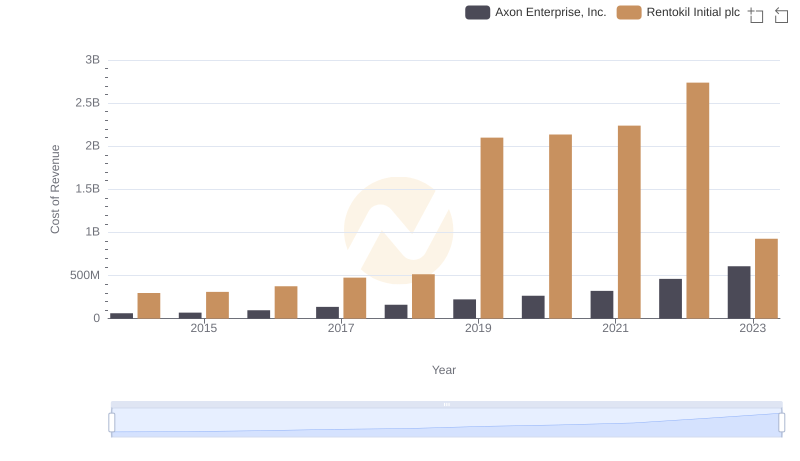
Axon Enterprise, Inc. vs Rentokil Initial plc: Efficiency in Cost of Revenue Explored
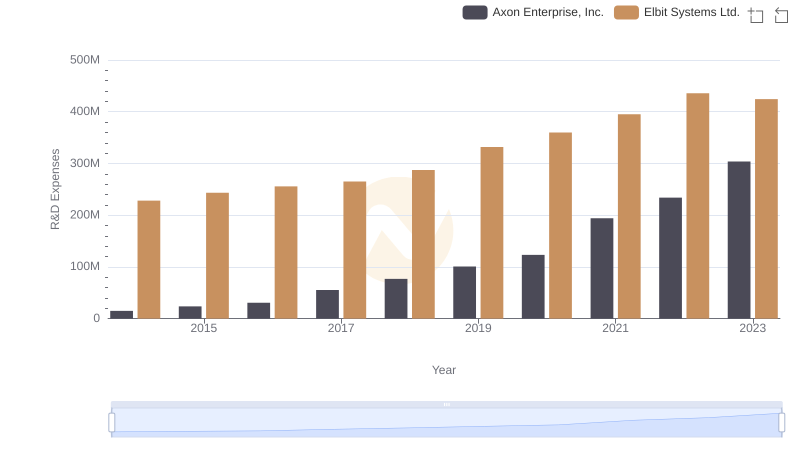
Analyzing R&D Budgets: Axon Enterprise, Inc. vs Elbit Systems Ltd.
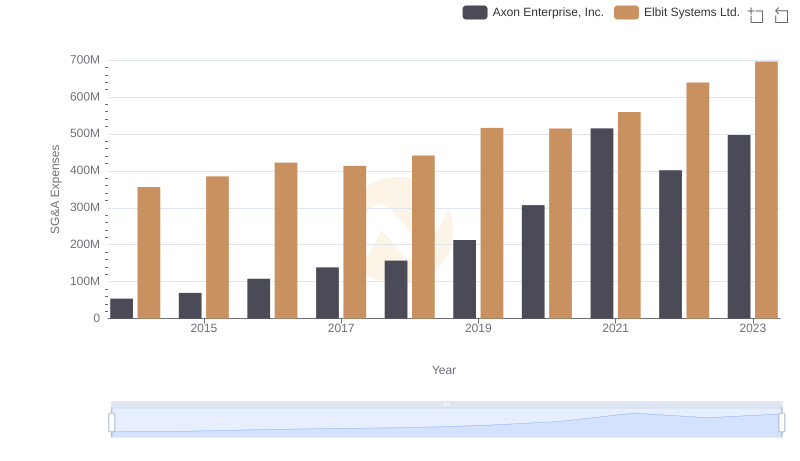
Comparing SG&A Expenses: Axon Enterprise, Inc. vs Elbit Systems Ltd. Trends and Insights