| __timestamp | Axon Enterprise, Inc. | Pool Corporation |
|---|---|---|
| Wednesday, January 1, 2014 | 54158000 | 454470000 |
| Thursday, January 1, 2015 | 69698000 | 459422000 |
| Friday, January 1, 2016 | 108076000 | 485228000 |
| Sunday, January 1, 2017 | 138692000 | 520918000 |
| Monday, January 1, 2018 | 156886000 | 556284000 |
| Tuesday, January 1, 2019 | 212959000 | 583679000 |
| Wednesday, January 1, 2020 | 307286000 | 659931000 |
| Friday, January 1, 2021 | 515007000 | 786808000 |
| Saturday, January 1, 2022 | 401575000 | 907629000 |
| Sunday, January 1, 2023 | 496874000 | 912927000 |
Unveiling the hidden dimensions of data
In the dynamic world of business, understanding the financial health of a company is crucial. Selling, General, and Administrative (SG&A) expenses are a key indicator of operational efficiency. This article delves into the SG&A trends of two industry giants: Axon Enterprise, Inc. and Pool Corporation, from 2014 to 2023.
Axon Enterprise, Inc. has seen a remarkable increase in SG&A expenses, growing by over 800% from 2014 to 2023. This surge reflects the company's aggressive expansion and investment in innovation. Notably, 2021 marked a peak, with expenses reaching nearly 10 times the 2014 figures, before stabilizing in subsequent years.
Pool Corporation, a leader in the outdoor living industry, has also experienced a steady rise in SG&A expenses, with a 100% increase over the same period. This growth underscores the company's strategic investments in market expansion and customer service enhancements.
Both companies demonstrate how strategic spending can drive growth, albeit with different trajectories and outcomes.
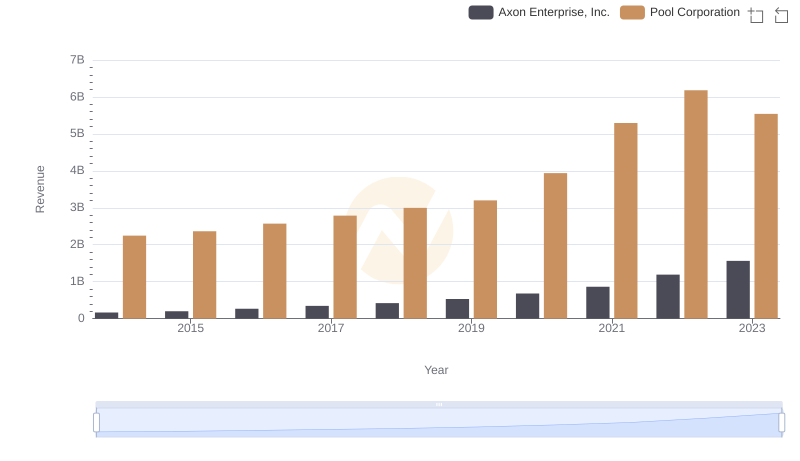
Axon Enterprise, Inc. vs Pool Corporation: Annual Revenue Growth Compared
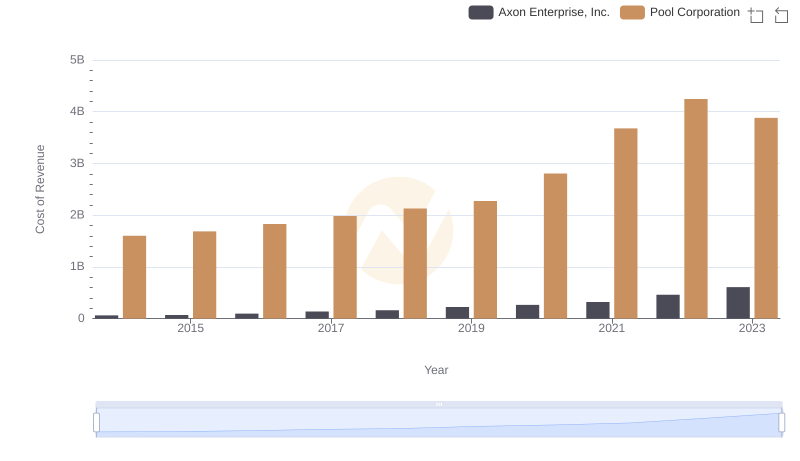
Cost of Revenue Comparison: Axon Enterprise, Inc. vs Pool Corporation
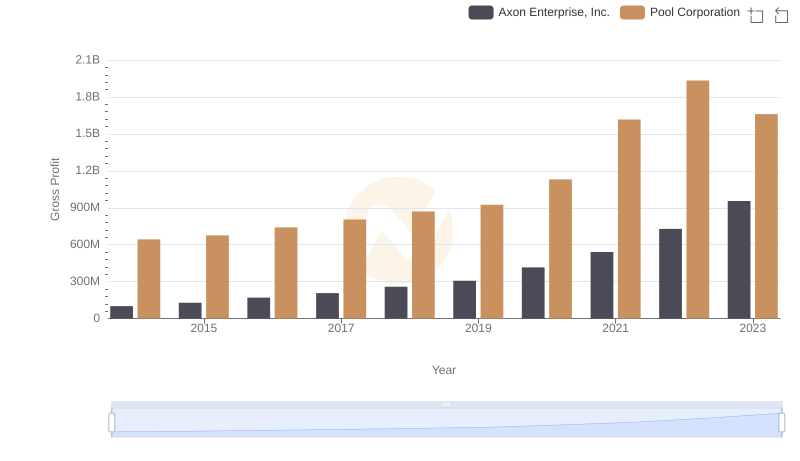
Gross Profit Analysis: Comparing Axon Enterprise, Inc. and Pool Corporation
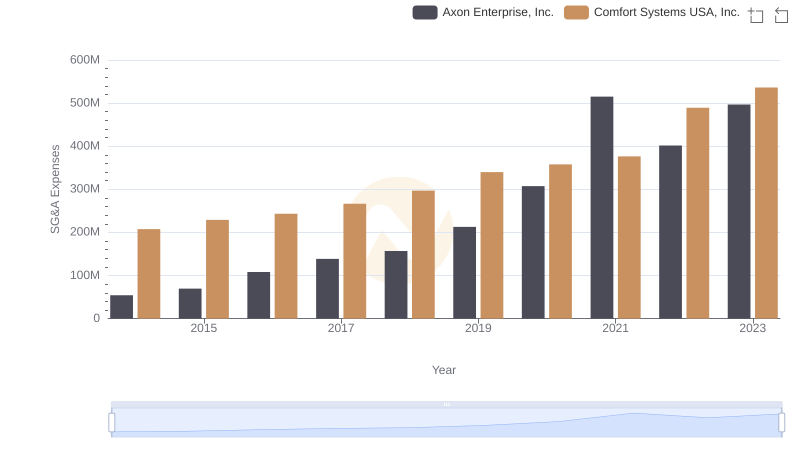
Axon Enterprise, Inc. or Comfort Systems USA, Inc.: Who Manages SG&A Costs Better?

Axon Enterprise, Inc. and Avery Dennison Corporation: SG&A Spending Patterns Compared
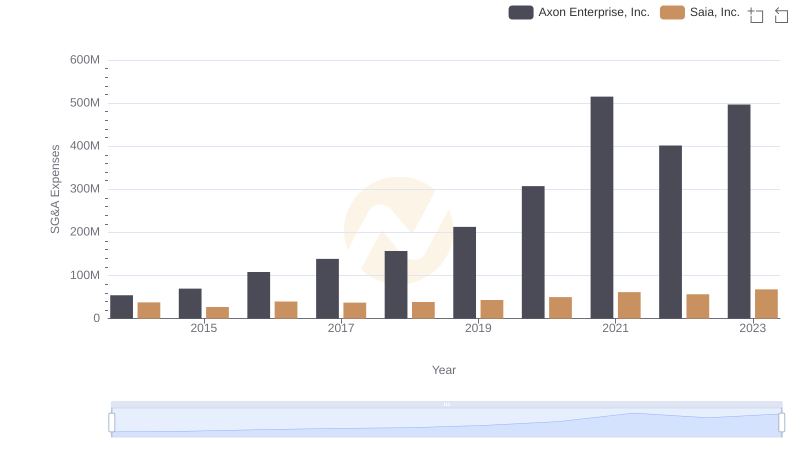
Axon Enterprise, Inc. and Saia, Inc.: SG&A Spending Patterns Compared
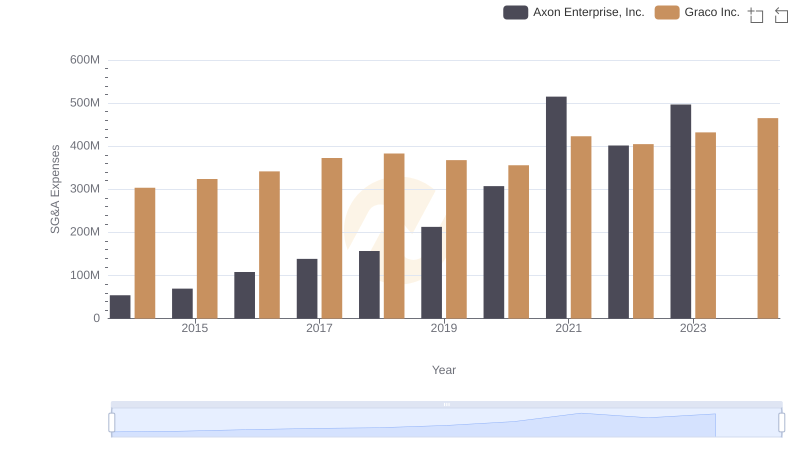
Cost Management Insights: SG&A Expenses for Axon Enterprise, Inc. and Graco Inc.
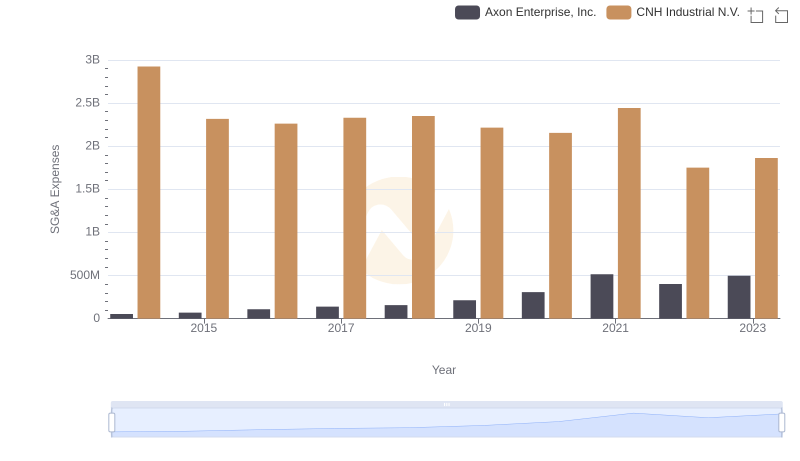
Operational Costs Compared: SG&A Analysis of Axon Enterprise, Inc. and CNH Industrial N.V.
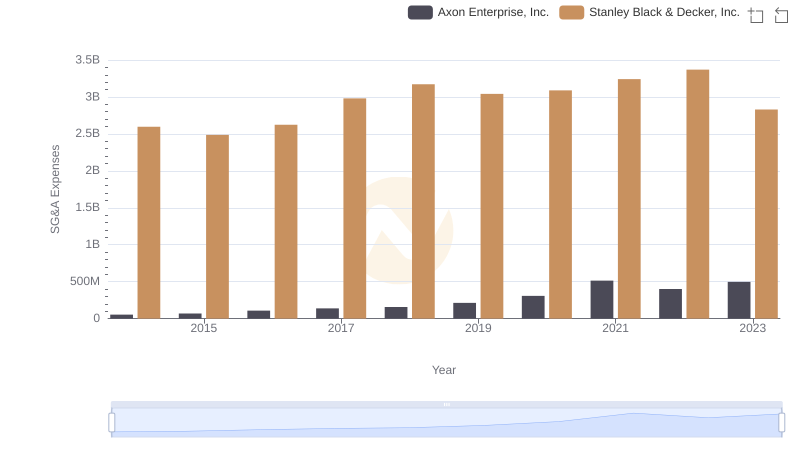
Axon Enterprise, Inc. vs Stanley Black & Decker, Inc.: SG&A Expense Trends
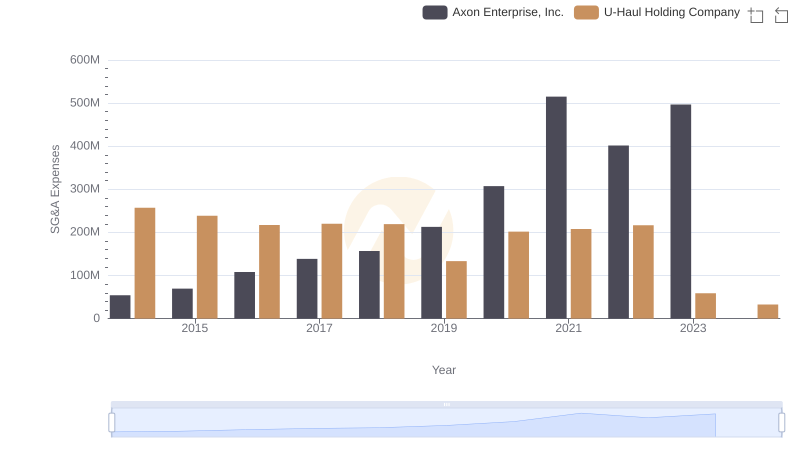
Cost Management Insights: SG&A Expenses for Axon Enterprise, Inc. and U-Haul Holding Company
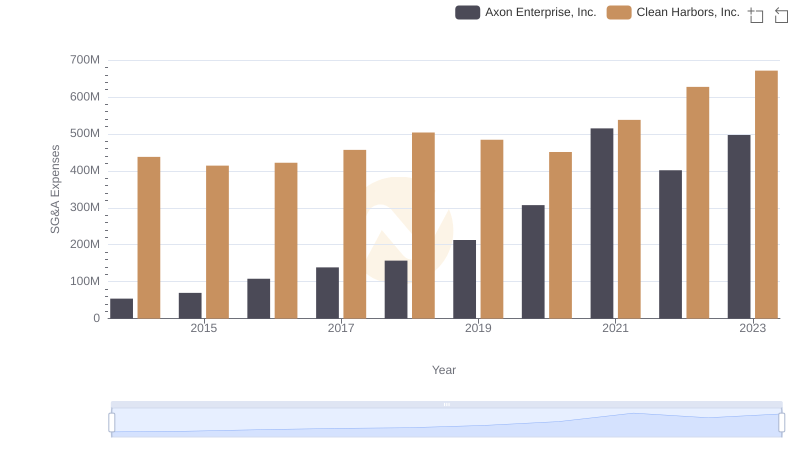
Comparing SG&A Expenses: Axon Enterprise, Inc. vs Clean Harbors, Inc. Trends and Insights
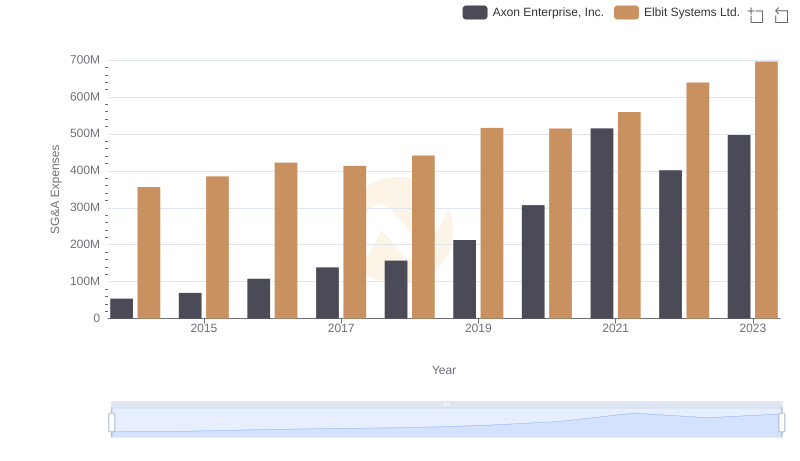
Comparing SG&A Expenses: Axon Enterprise, Inc. vs Elbit Systems Ltd. Trends and Insights