| __timestamp | Axon Enterprise, Inc. | Saia, Inc. |
|---|---|---|
| Wednesday, January 1, 2014 | 62977000 | 1113053000 |
| Thursday, January 1, 2015 | 69245000 | 1067191000 |
| Friday, January 1, 2016 | 97709000 | 1058979000 |
| Sunday, January 1, 2017 | 136710000 | 1203464000 |
| Monday, January 1, 2018 | 161485000 | 1423779000 |
| Tuesday, January 1, 2019 | 223574000 | 1537082000 |
| Wednesday, January 1, 2020 | 264672000 | 1538518000 |
| Friday, January 1, 2021 | 322471000 | 1837017000 |
| Saturday, January 1, 2022 | 461297000 | 2201094000 |
| Sunday, January 1, 2023 | 608009000 | 2282501000 |
In pursuit of knowledge
In the ever-evolving landscape of American business, understanding cost dynamics is crucial. This analysis delves into the cost of revenue trends for Axon Enterprise, Inc. and Saia, Inc. from 2014 to 2023. Over this period, Axon Enterprise, known for its innovative public safety technologies, saw its cost of revenue grow by nearly 866%, reflecting its rapid expansion and increased production capabilities. In contrast, Saia, Inc., a leader in the freight transportation sector, experienced a more modest increase of approximately 105%, indicative of its steady growth and operational efficiency.
These trends underscore the diverse growth trajectories of these two industry leaders.
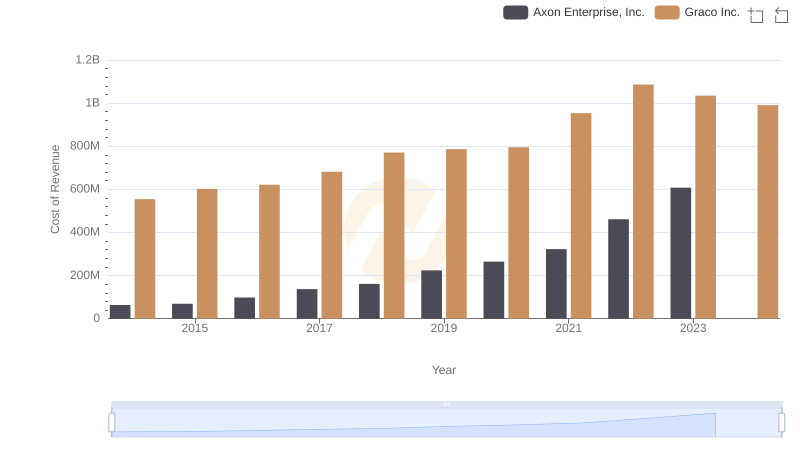
Axon Enterprise, Inc. vs Graco Inc.: Efficiency in Cost of Revenue Explored
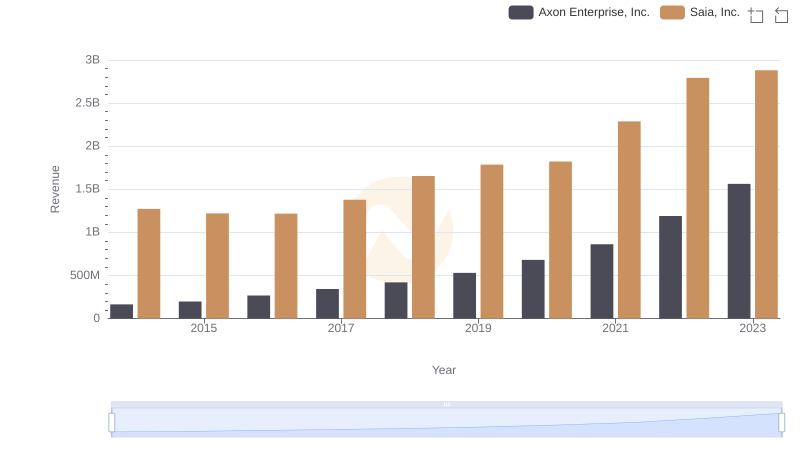
Axon Enterprise, Inc. or Saia, Inc.: Who Leads in Yearly Revenue?
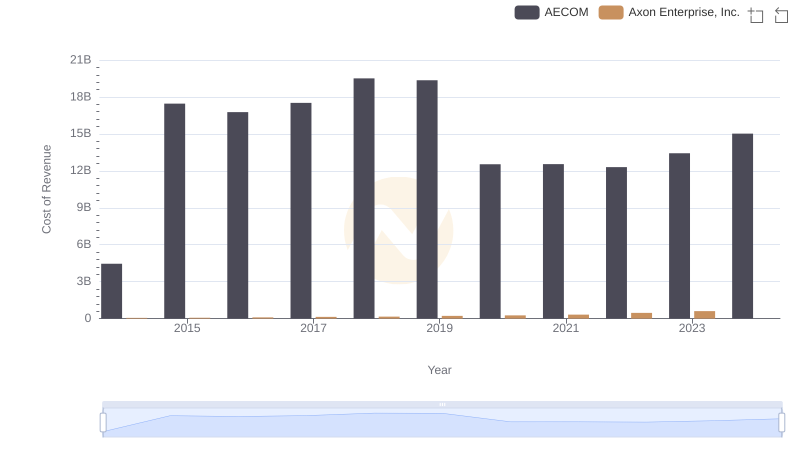
Comparing Cost of Revenue Efficiency: Axon Enterprise, Inc. vs AECOM
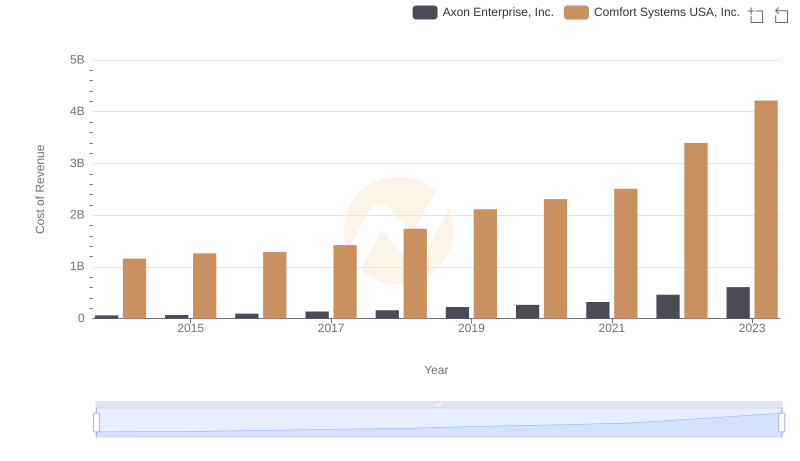
Analyzing Cost of Revenue: Axon Enterprise, Inc. and Comfort Systems USA, Inc.
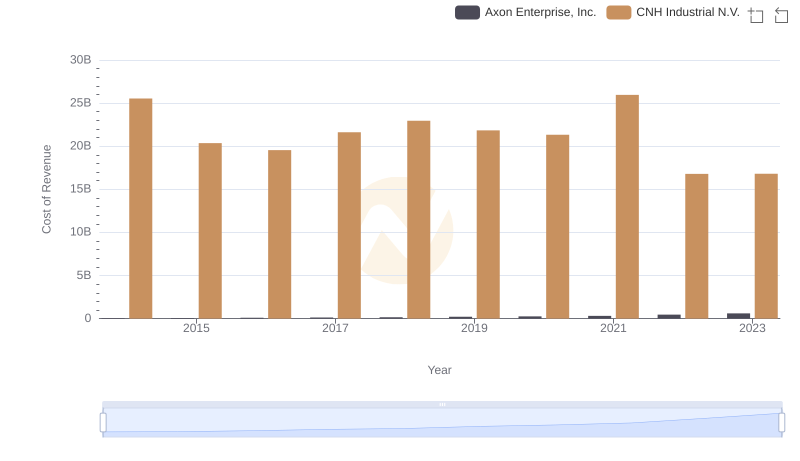
Cost Insights: Breaking Down Axon Enterprise, Inc. and CNH Industrial N.V.'s Expenses
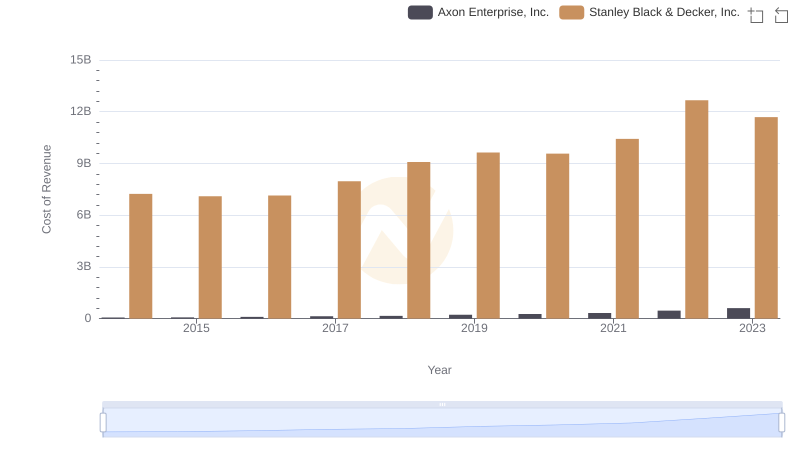
Cost Insights: Breaking Down Axon Enterprise, Inc. and Stanley Black & Decker, Inc.'s Expenses
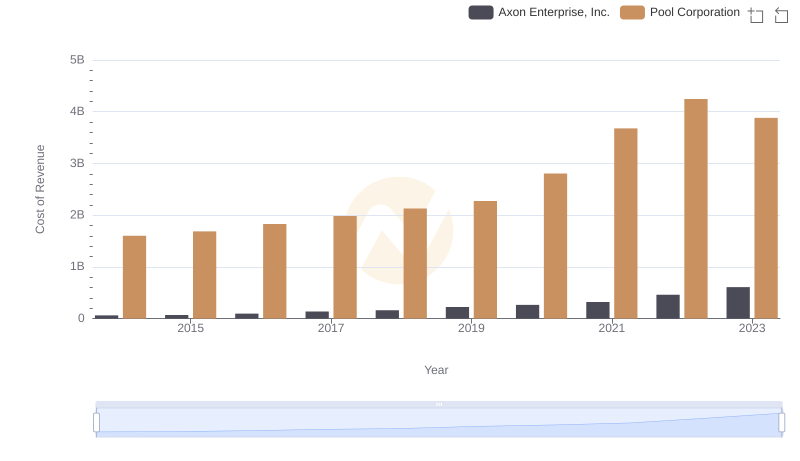
Cost of Revenue Comparison: Axon Enterprise, Inc. vs Pool Corporation
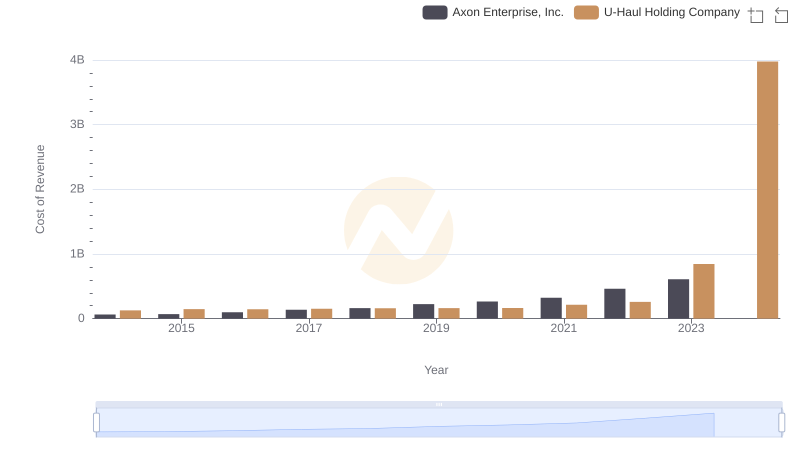
Cost Insights: Breaking Down Axon Enterprise, Inc. and U-Haul Holding Company's Expenses
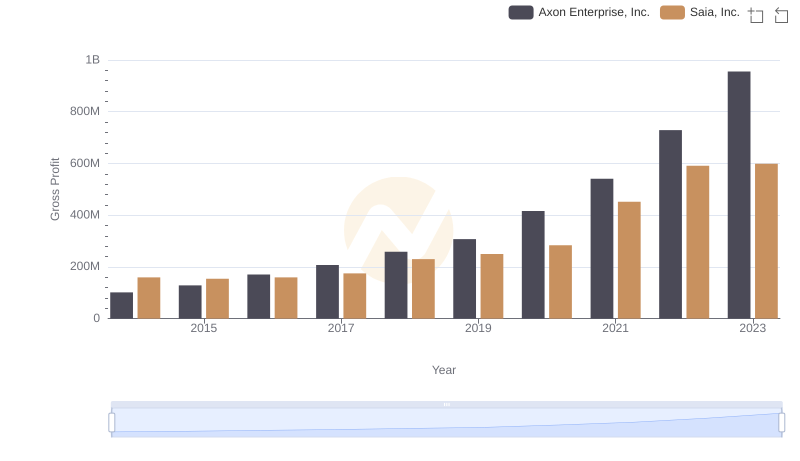
Gross Profit Comparison: Axon Enterprise, Inc. and Saia, Inc. Trends
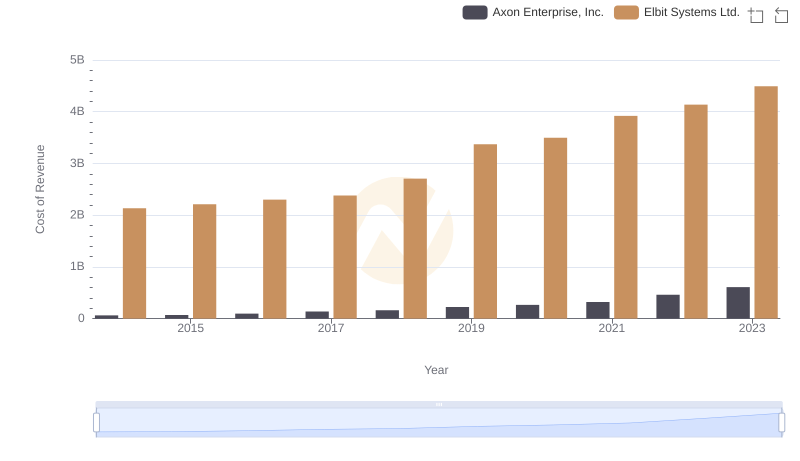
Analyzing Cost of Revenue: Axon Enterprise, Inc. and Elbit Systems Ltd.
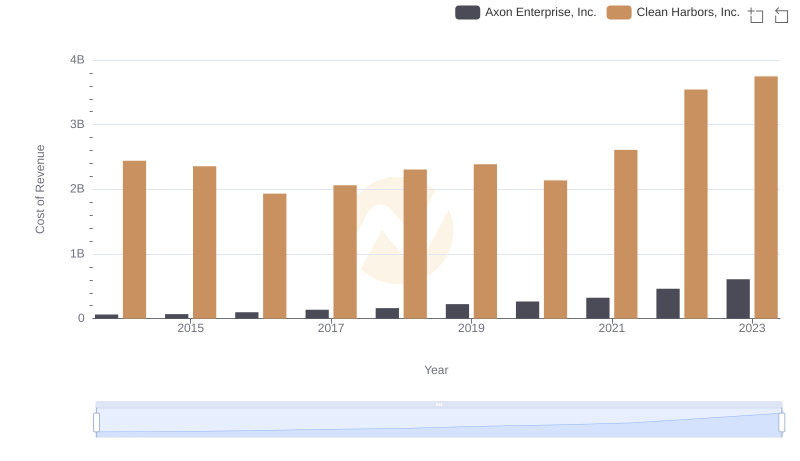
Analyzing Cost of Revenue: Axon Enterprise, Inc. and Clean Harbors, Inc.
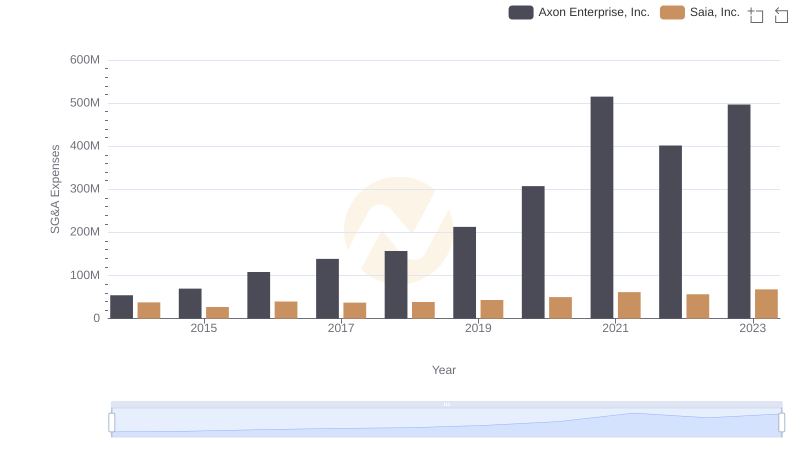
Axon Enterprise, Inc. and Saia, Inc.: SG&A Spending Patterns Compared