| __timestamp | Axon Enterprise, Inc. | CNH Industrial N.V. |
|---|---|---|
| Wednesday, January 1, 2014 | 62977000 | 25534000000 |
| Thursday, January 1, 2015 | 69245000 | 20357000000 |
| Friday, January 1, 2016 | 97709000 | 19539000000 |
| Sunday, January 1, 2017 | 136710000 | 21621000000 |
| Monday, January 1, 2018 | 161485000 | 22958000000 |
| Tuesday, January 1, 2019 | 223574000 | 21832000000 |
| Wednesday, January 1, 2020 | 264672000 | 21327000000 |
| Friday, January 1, 2021 | 322471000 | 25951000000 |
| Saturday, January 1, 2022 | 461297000 | 16797000000 |
| Sunday, January 1, 2023 | 608009000 | 16805000000 |
Unleashing the power of data
In the ever-evolving landscape of industrial and technological advancements, understanding the cost dynamics of leading companies is crucial. Axon Enterprise, Inc., a pioneer in public safety technology, and CNH Industrial N.V., a global leader in capital goods, present a fascinating study in contrasts. From 2014 to 2023, Axon Enterprise's cost of revenue surged by nearly 866%, reflecting its aggressive growth strategy and innovation in the tech sector. In contrast, CNH Industrial's cost of revenue exhibited a more stable trend, with a slight decline of about 34% over the same period, indicative of its mature market position and operational efficiencies.
This decade-long analysis highlights the strategic differences between a burgeoning tech company and an established industrial giant. As Axon continues to expand its market footprint, CNH Industrial remains a stalwart in its field, balancing cost with consistent output.
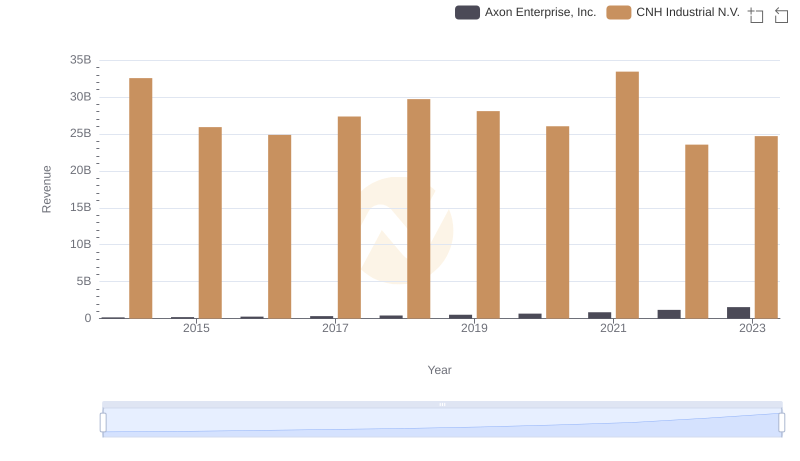
Axon Enterprise, Inc. vs CNH Industrial N.V.: Examining Key Revenue Metrics
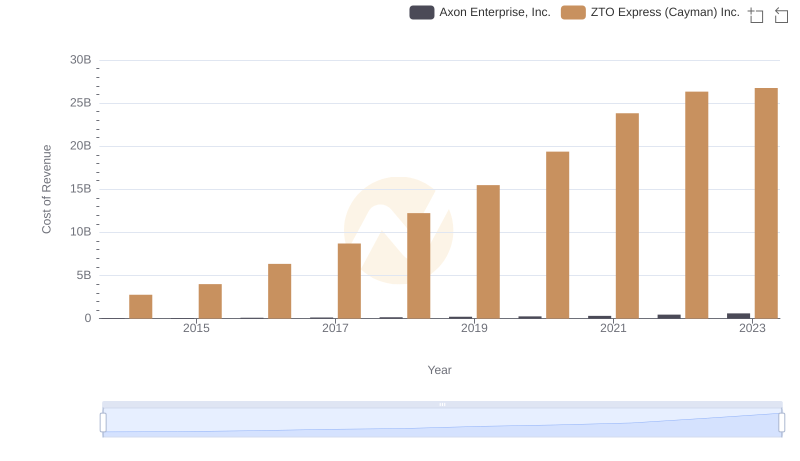
Analyzing Cost of Revenue: Axon Enterprise, Inc. and ZTO Express (Cayman) Inc.
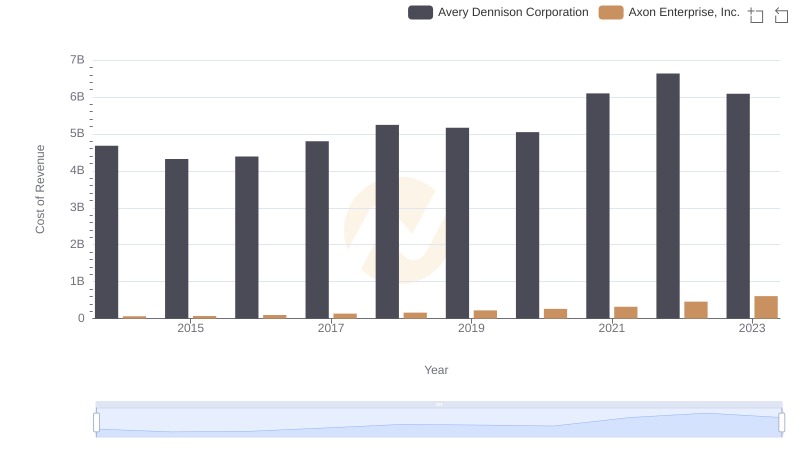
Comparing Cost of Revenue Efficiency: Axon Enterprise, Inc. vs Avery Dennison Corporation
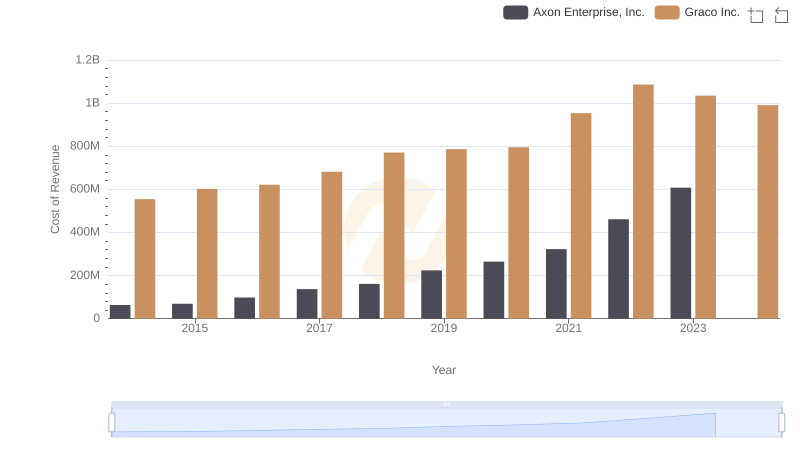
Axon Enterprise, Inc. vs Graco Inc.: Efficiency in Cost of Revenue Explored
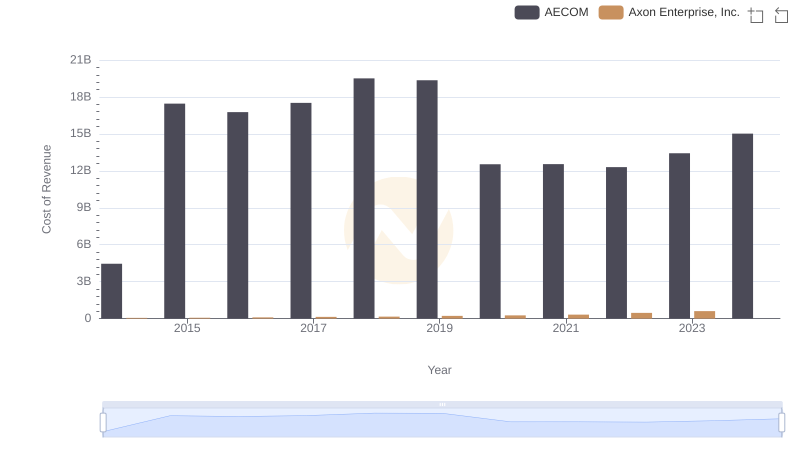
Comparing Cost of Revenue Efficiency: Axon Enterprise, Inc. vs AECOM
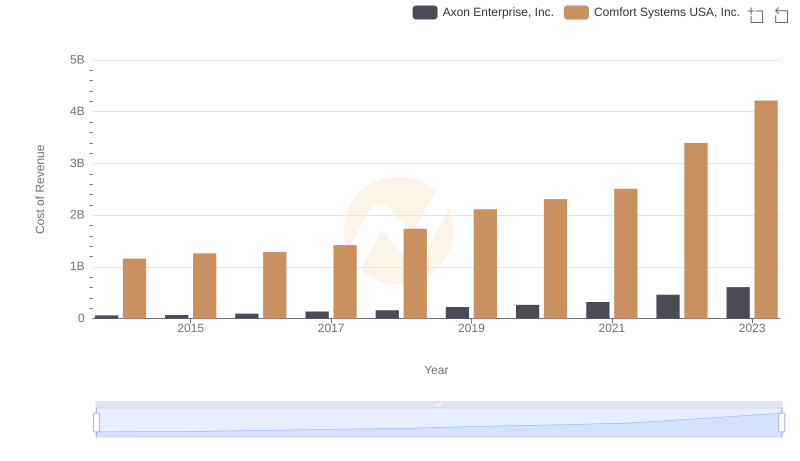
Analyzing Cost of Revenue: Axon Enterprise, Inc. and Comfort Systems USA, Inc.
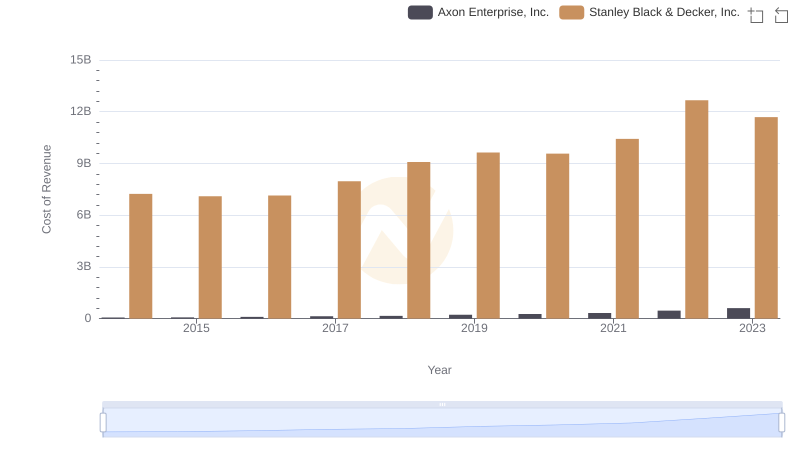
Cost Insights: Breaking Down Axon Enterprise, Inc. and Stanley Black & Decker, Inc.'s Expenses
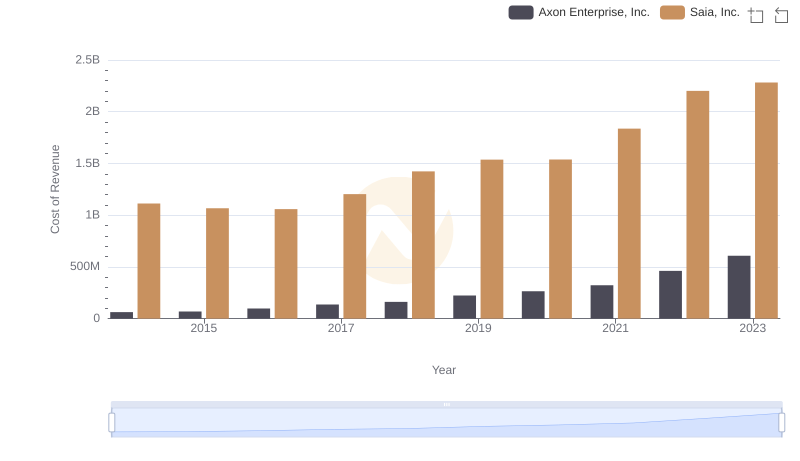
Cost of Revenue Trends: Axon Enterprise, Inc. vs Saia, Inc.
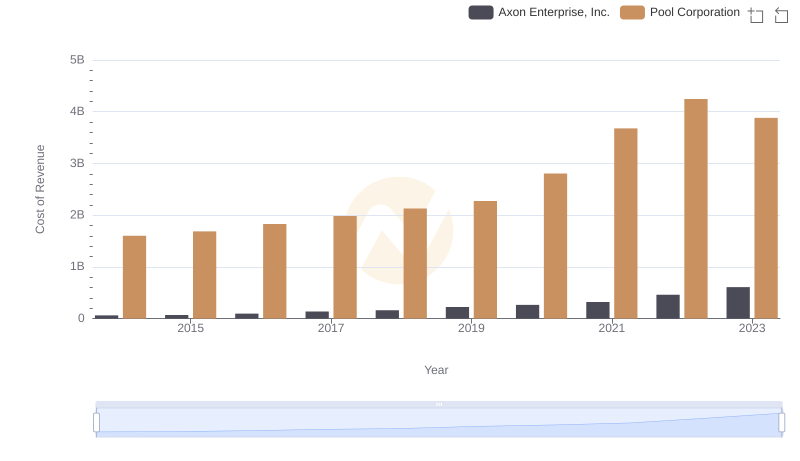
Cost of Revenue Comparison: Axon Enterprise, Inc. vs Pool Corporation
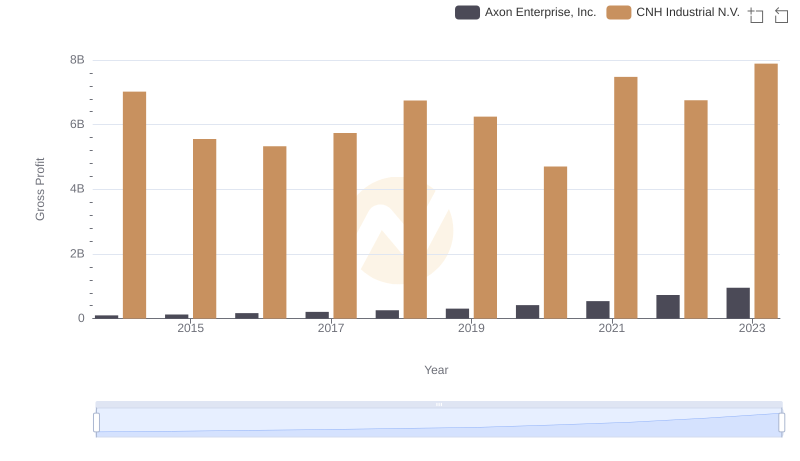
Who Generates Higher Gross Profit? Axon Enterprise, Inc. or CNH Industrial N.V.
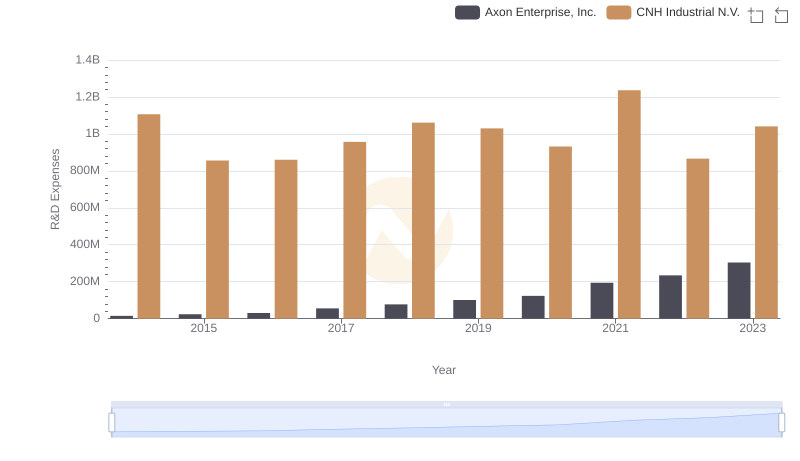
Axon Enterprise, Inc. or CNH Industrial N.V.: Who Invests More in Innovation?
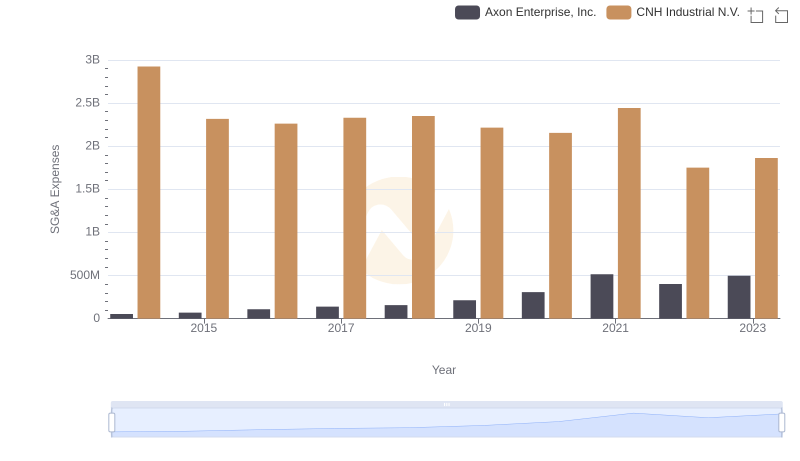
Operational Costs Compared: SG&A Analysis of Axon Enterprise, Inc. and CNH Industrial N.V.