| __timestamp | Axon Enterprise, Inc. | U-Haul Holding Company |
|---|---|---|
| Wednesday, January 1, 2014 | 62977000 | 127270000 |
| Thursday, January 1, 2015 | 69245000 | 146072000 |
| Friday, January 1, 2016 | 97709000 | 144990000 |
| Sunday, January 1, 2017 | 136710000 | 152485000 |
| Monday, January 1, 2018 | 161485000 | 160489000 |
| Tuesday, January 1, 2019 | 223574000 | 162142000 |
| Wednesday, January 1, 2020 | 264672000 | 164018000 |
| Friday, January 1, 2021 | 322471000 | 214059000 |
| Saturday, January 1, 2022 | 461297000 | 259585000 |
| Sunday, January 1, 2023 | 608009000 | 844894000 |
| Monday, January 1, 2024 | 3976040000 |
In pursuit of knowledge
In the ever-evolving landscape of corporate finance, understanding cost structures is crucial. This analysis delves into the cost of revenue trends for Axon Enterprise, Inc. and U-Haul Holding Company from 2014 to 2023. Over this period, Axon Enterprise, Inc. has seen a remarkable increase in its cost of revenue, growing by approximately 866%, from $63 million in 2014 to $608 million in 2023. This surge reflects the company's aggressive expansion and investment in its product offerings.
Conversely, U-Haul Holding Company experienced a more modest growth of around 564% in the same timeframe, with costs rising from $127 million to $845 million. Notably, 2024 data for Axon is missing, indicating potential reporting delays or strategic shifts. These insights provide a window into the financial strategies of these industry giants, highlighting their distinct approaches to managing operational expenses.
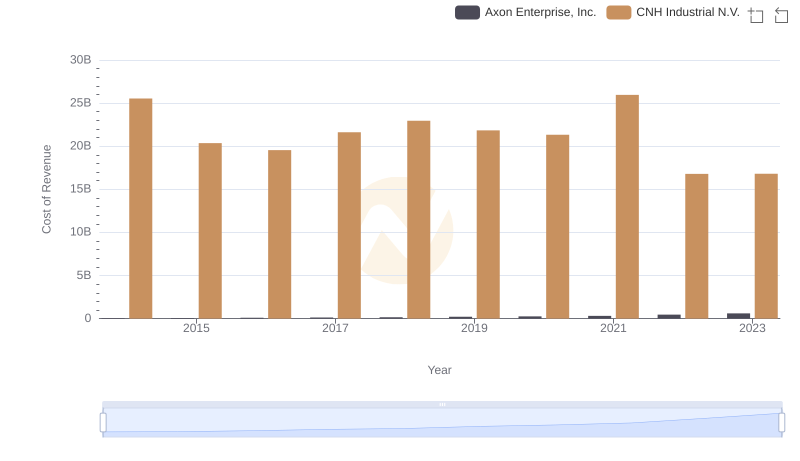
Cost Insights: Breaking Down Axon Enterprise, Inc. and CNH Industrial N.V.'s Expenses
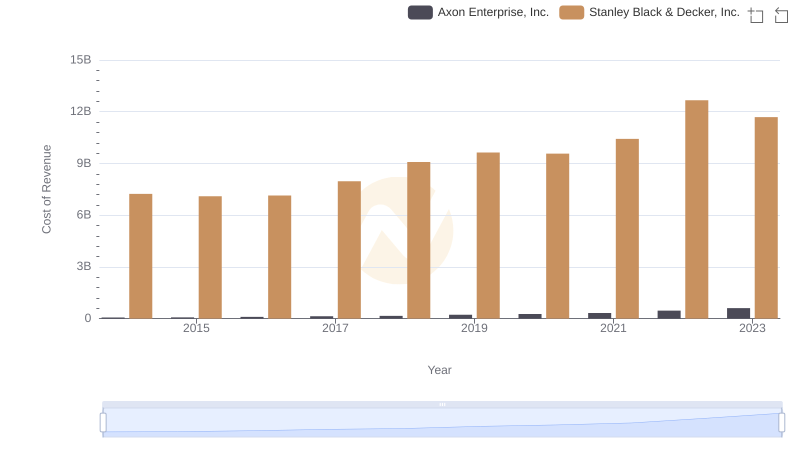
Cost Insights: Breaking Down Axon Enterprise, Inc. and Stanley Black & Decker, Inc.'s Expenses
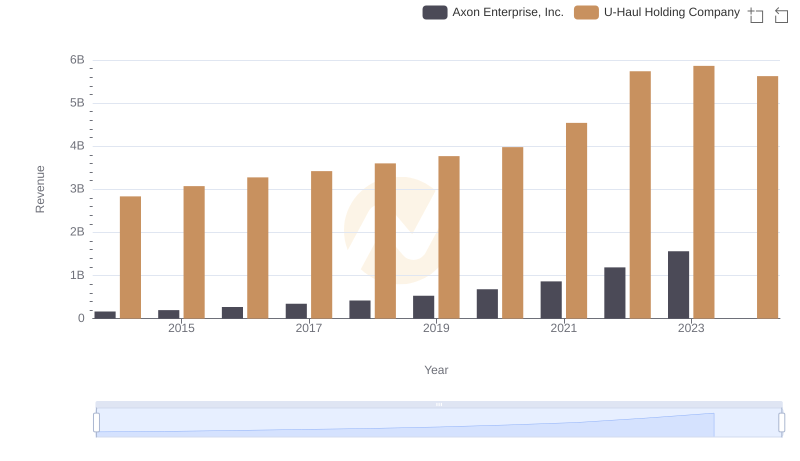
Who Generates More Revenue? Axon Enterprise, Inc. or U-Haul Holding Company
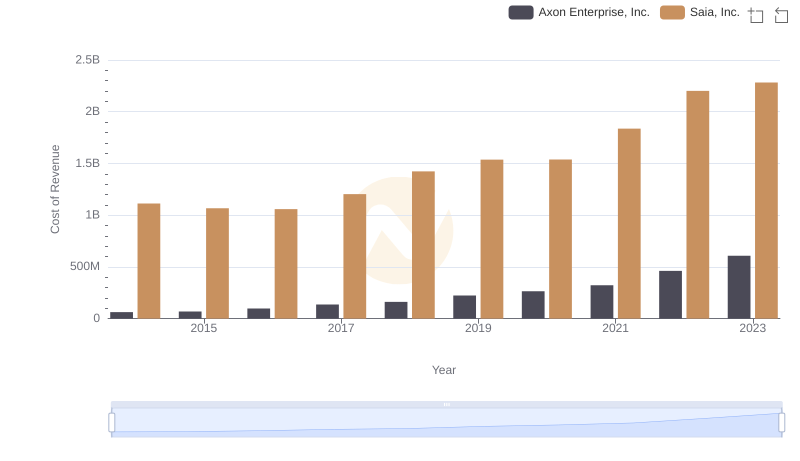
Cost of Revenue Trends: Axon Enterprise, Inc. vs Saia, Inc.
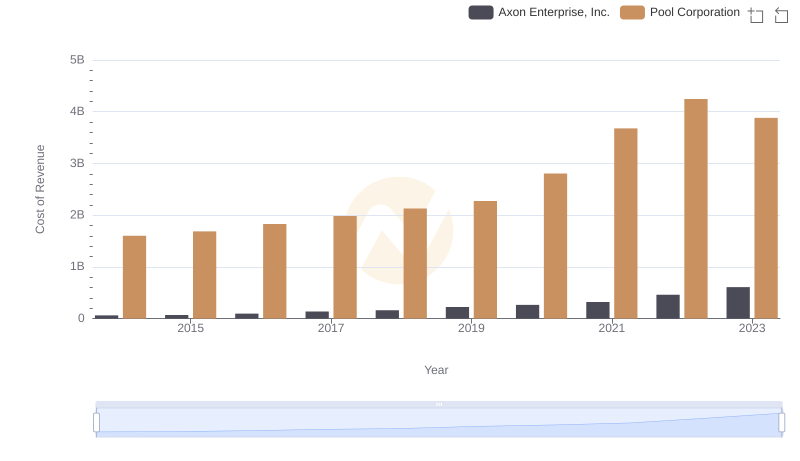
Cost of Revenue Comparison: Axon Enterprise, Inc. vs Pool Corporation
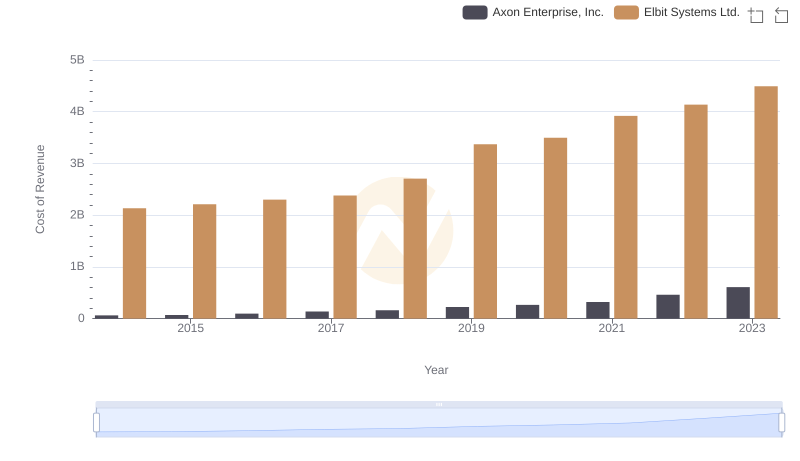
Analyzing Cost of Revenue: Axon Enterprise, Inc. and Elbit Systems Ltd.
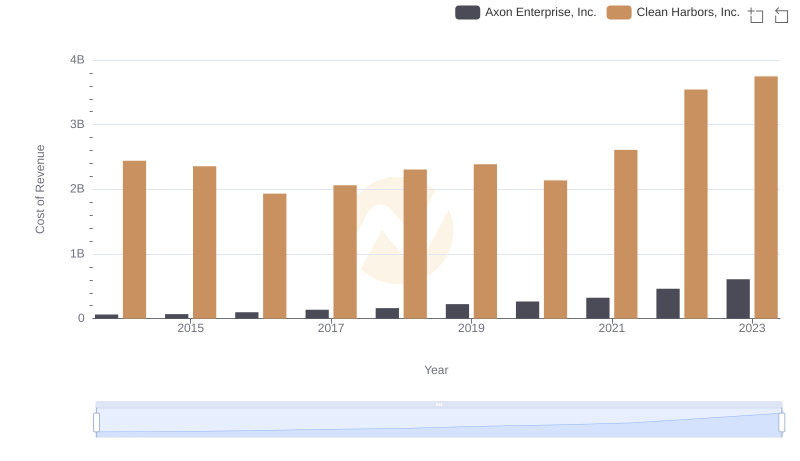
Analyzing Cost of Revenue: Axon Enterprise, Inc. and Clean Harbors, Inc.
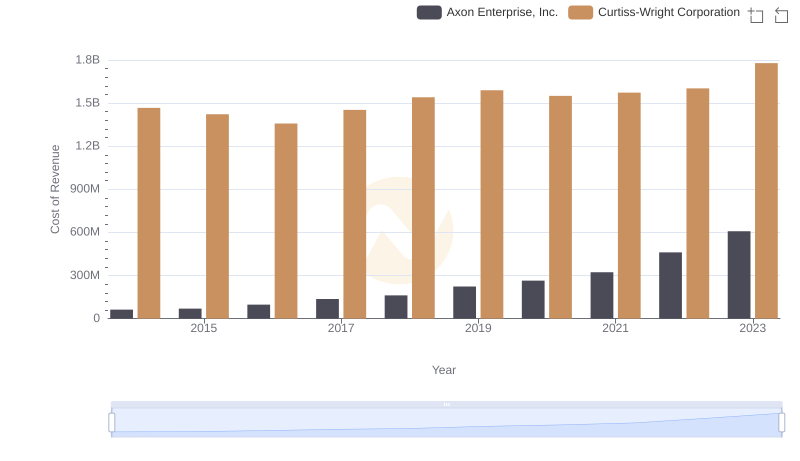
Cost of Revenue Trends: Axon Enterprise, Inc. vs Curtiss-Wright Corporation
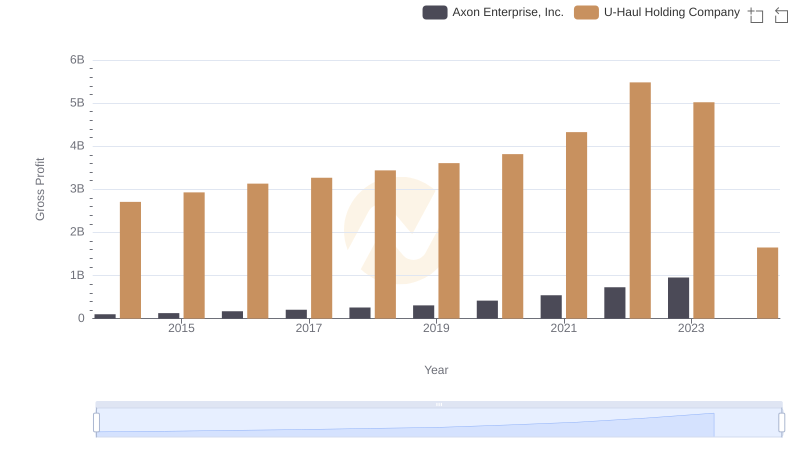
Gross Profit Analysis: Comparing Axon Enterprise, Inc. and U-Haul Holding Company
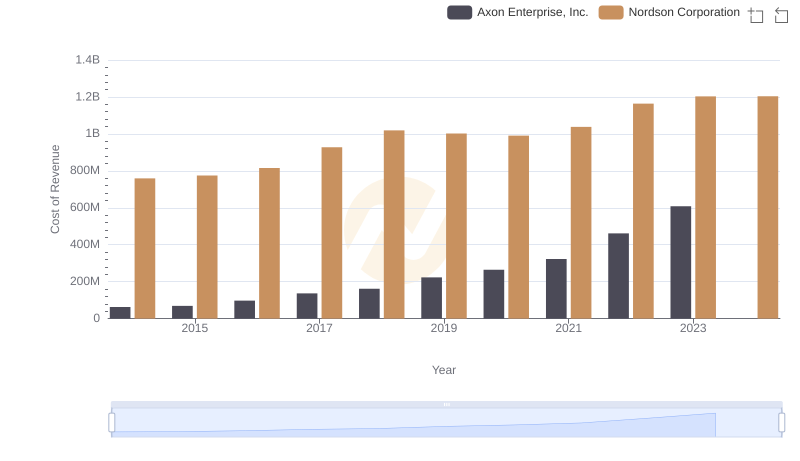
Cost of Revenue Trends: Axon Enterprise, Inc. vs Nordson Corporation
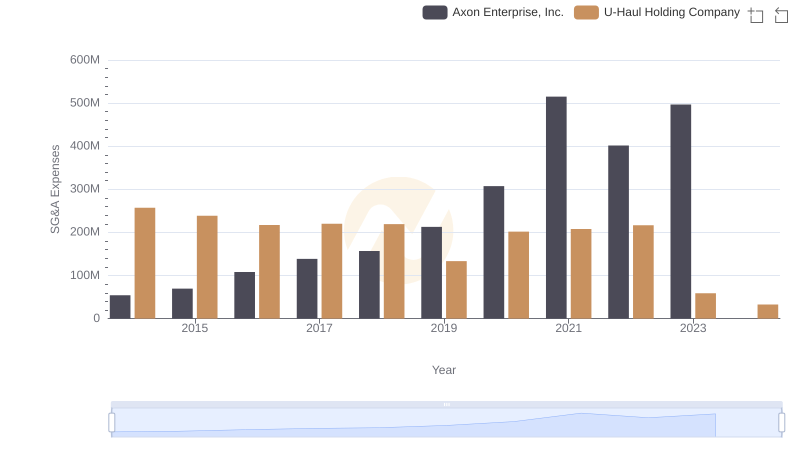
Cost Management Insights: SG&A Expenses for Axon Enterprise, Inc. and U-Haul Holding Company