| __timestamp | Axon Enterprise, Inc. | Comfort Systems USA, Inc. |
|---|---|---|
| Wednesday, January 1, 2014 | 62977000 | 1161024000 |
| Thursday, January 1, 2015 | 69245000 | 1262390000 |
| Friday, January 1, 2016 | 97709000 | 1290331000 |
| Sunday, January 1, 2017 | 136710000 | 1421641000 |
| Monday, January 1, 2018 | 161485000 | 1736600000 |
| Tuesday, January 1, 2019 | 223574000 | 2113334000 |
| Wednesday, January 1, 2020 | 264672000 | 2309676000 |
| Friday, January 1, 2021 | 322471000 | 2510429000 |
| Saturday, January 1, 2022 | 461297000 | 3398756000 |
| Sunday, January 1, 2023 | 608009000 | 4216251000 |
Cracking the code
In the ever-evolving landscape of American business, understanding the cost of revenue is crucial for evaluating a company's financial health. This analysis delves into the cost of revenue trends for Axon Enterprise, Inc. and Comfort Systems USA, Inc. from 2014 to 2023. Over this period, Axon Enterprise, Inc. saw a staggering increase of approximately 866% in its cost of revenue, reflecting its aggressive growth strategy and expansion in the public safety technology sector. Meanwhile, Comfort Systems USA, Inc., a leader in mechanical services, experienced a 263% rise, indicating steady growth in the construction and HVAC industries. By 2023, Comfort Systems USA, Inc.'s cost of revenue was nearly seven times that of Axon, highlighting the scale and operational demands of the two distinct industries. This comparative analysis offers valuable insights into how different sectors manage their cost structures over time.
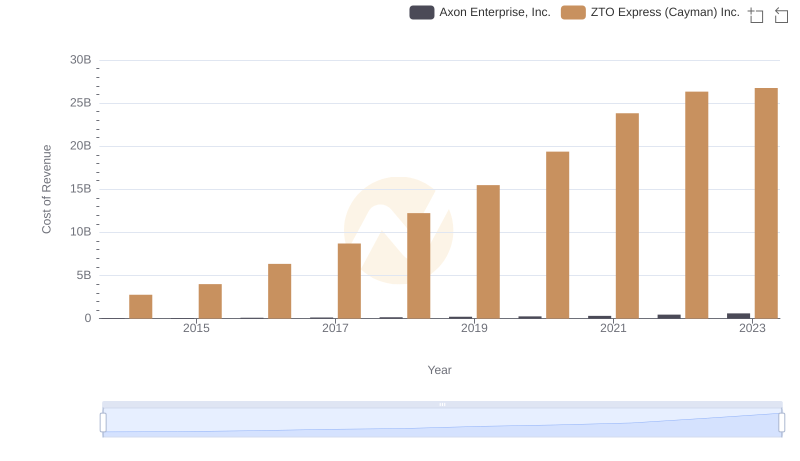
Analyzing Cost of Revenue: Axon Enterprise, Inc. and ZTO Express (Cayman) Inc.
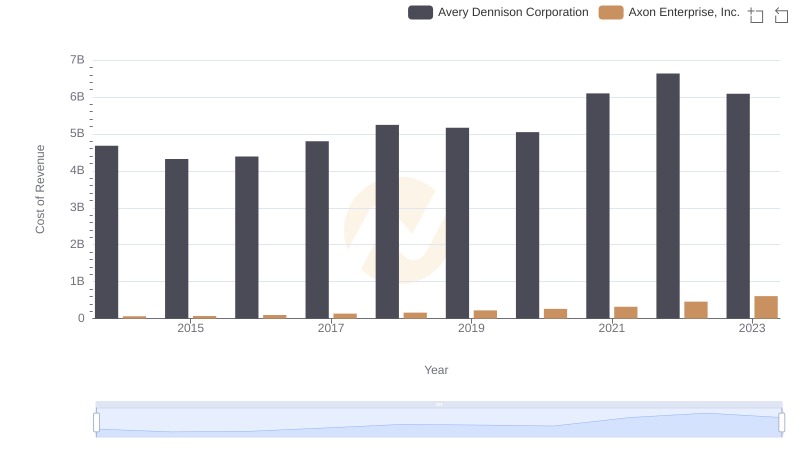
Comparing Cost of Revenue Efficiency: Axon Enterprise, Inc. vs Avery Dennison Corporation
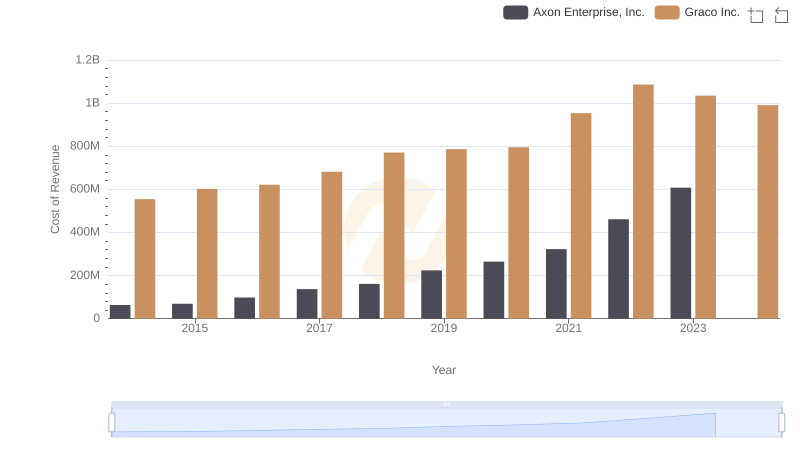
Axon Enterprise, Inc. vs Graco Inc.: Efficiency in Cost of Revenue Explored
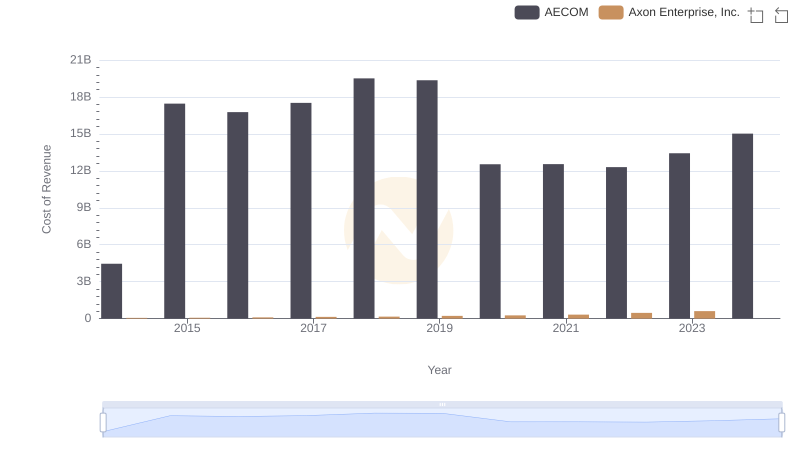
Comparing Cost of Revenue Efficiency: Axon Enterprise, Inc. vs AECOM
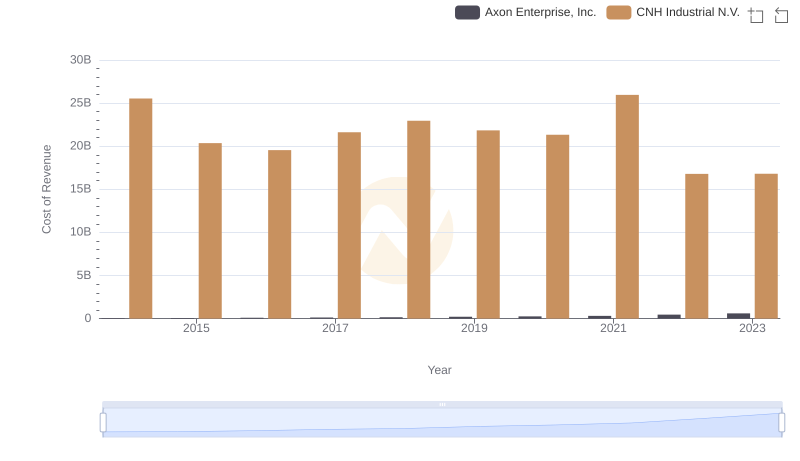
Cost Insights: Breaking Down Axon Enterprise, Inc. and CNH Industrial N.V.'s Expenses
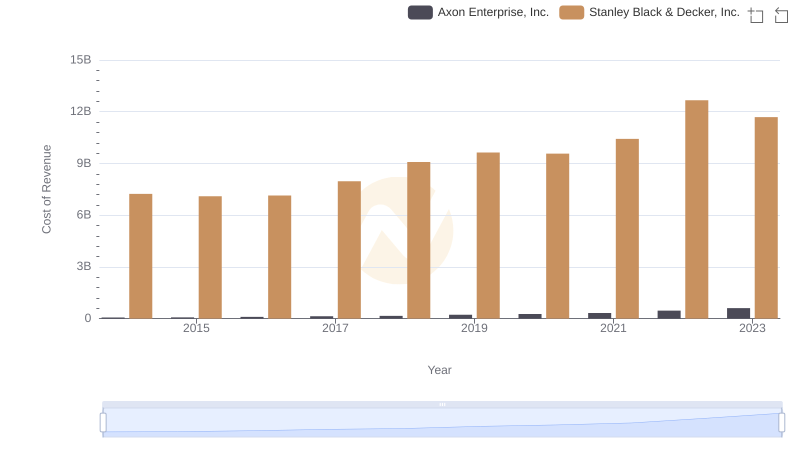
Cost Insights: Breaking Down Axon Enterprise, Inc. and Stanley Black & Decker, Inc.'s Expenses
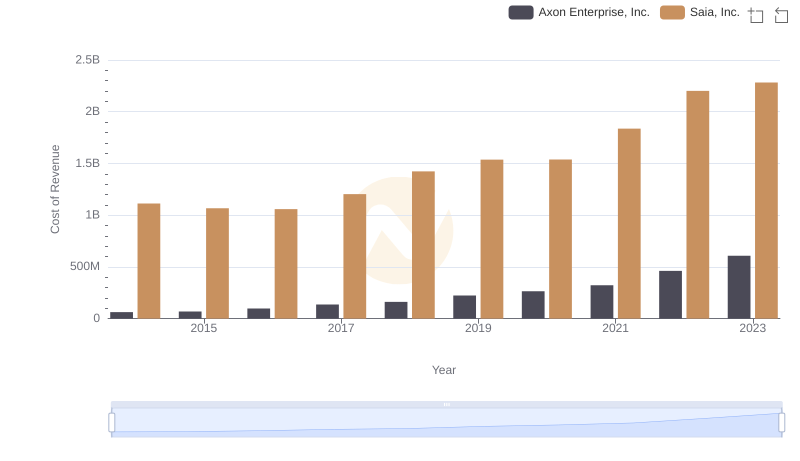
Cost of Revenue Trends: Axon Enterprise, Inc. vs Saia, Inc.
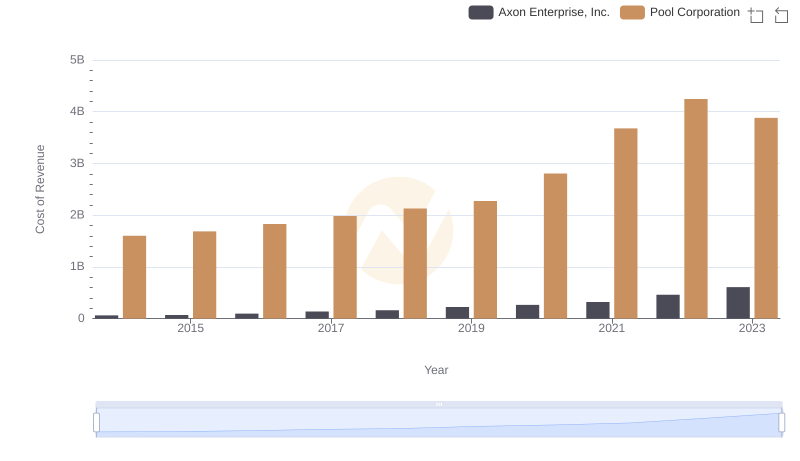
Cost of Revenue Comparison: Axon Enterprise, Inc. vs Pool Corporation
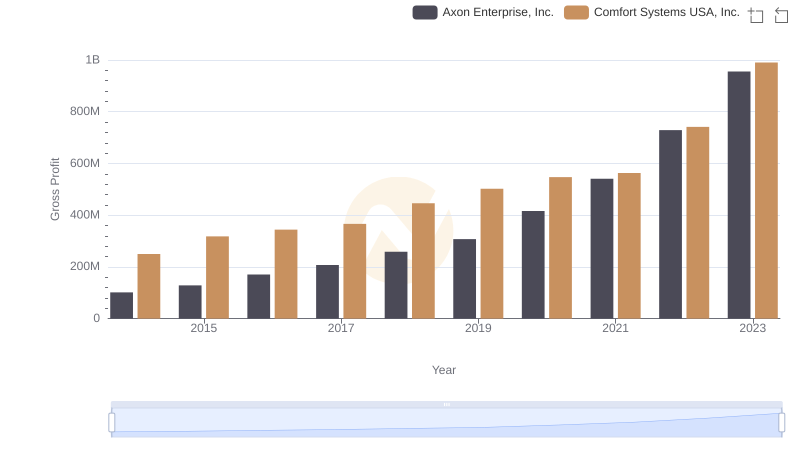
Gross Profit Comparison: Axon Enterprise, Inc. and Comfort Systems USA, Inc. Trends
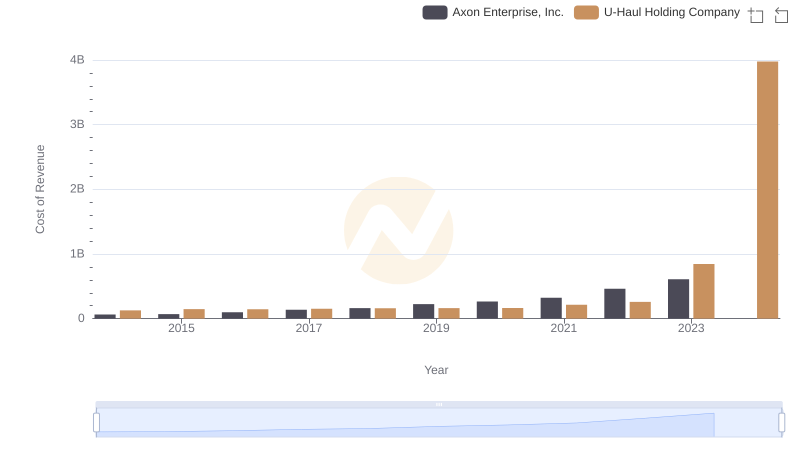
Cost Insights: Breaking Down Axon Enterprise, Inc. and U-Haul Holding Company's Expenses
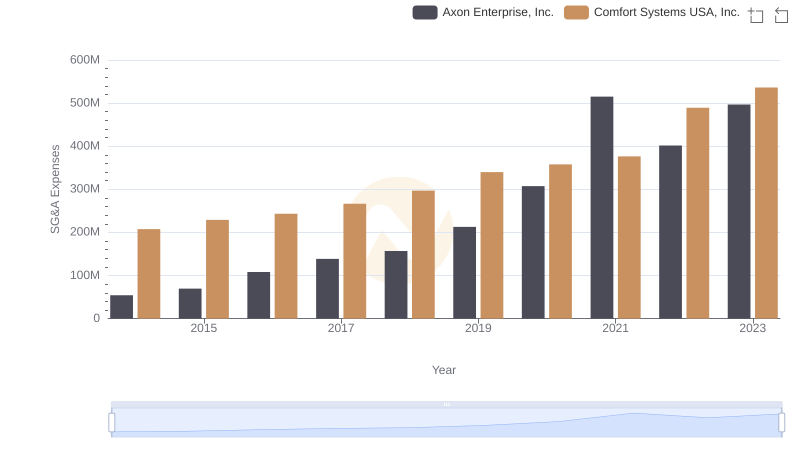
Axon Enterprise, Inc. or Comfort Systems USA, Inc.: Who Manages SG&A Costs Better?